Fig. 7
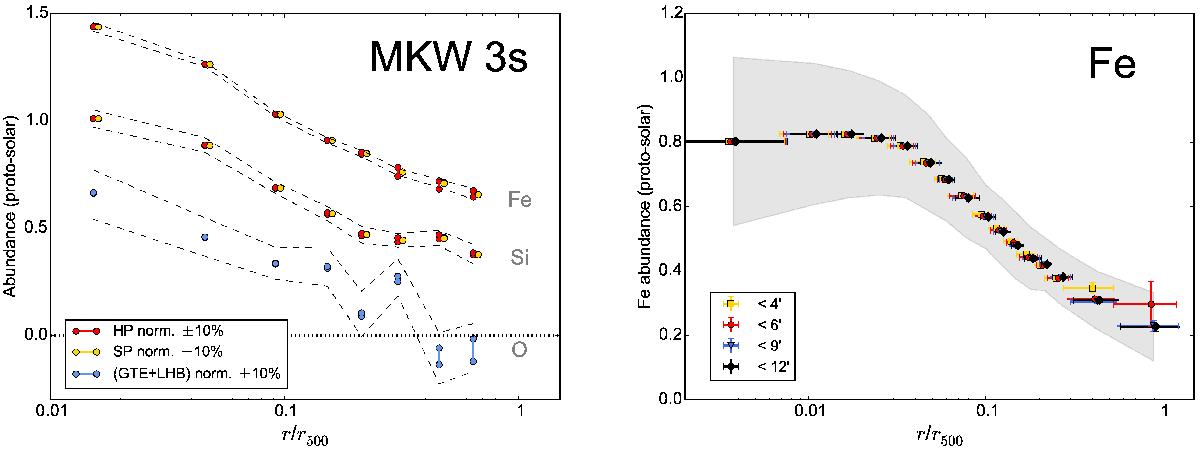
Left: effects of the background model uncertainties on the Fe, Si, and O radial profiles of MKW 3s. The normalisation of the HP, SP, and GTE+LHB were successively fixed to ±10% of their best-fit values (see text). The dashed lines show the range constrained by the statistical uncertainties for each profile. For clarity, the Si and Fe profiles are shifted up by 0.25 and 0.5, respectively. Right: comparison of the average Fe profile for different truncated radii adopted in each observation. Data points with different colours are slightly shifted for clarity.
Current usage metrics show cumulative count of Article Views (full-text article views including HTML views, PDF and ePub downloads, according to the available data) and Abstracts Views on Vision4Press platform.
Data correspond to usage on the plateform after 2015. The current usage metrics is available 48-96 hours after online publication and is updated daily on week days.
Initial download of the metrics may take a while.