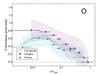
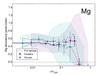
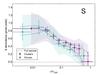
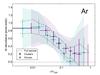
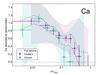
Fig. 4
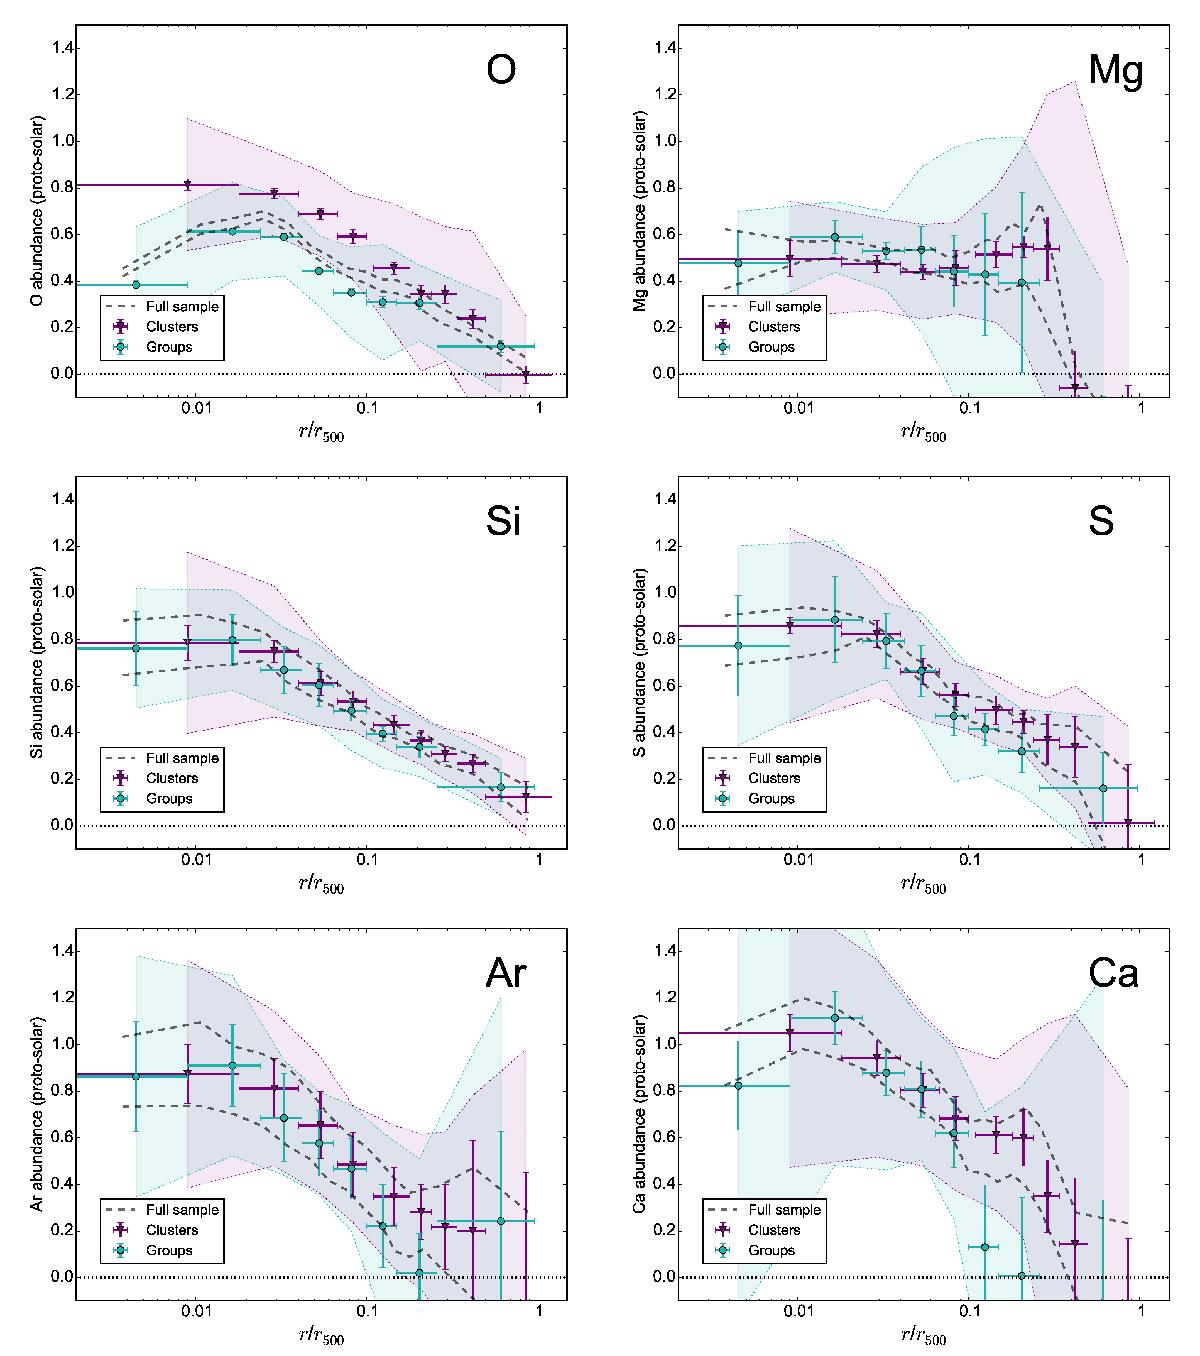
Comparison of the average abundance radial profiles between clusters (>1.7 keV) and groups/ellipticals (<1.7 keV). The error bars contain the statistical uncertainties and MOS-pn uncertainties (Sect. 4.3) except for the O abundance profiles, which are only measured with MOS. The corresponding shaded areas show the scatter of the measurements. The two dashed lines indicate the upper and lower error bars of the corresponding profiles over the full sample (Fig. 3), without scatter for clarity.
Current usage metrics show cumulative count of Article Views (full-text article views including HTML views, PDF and ePub downloads, according to the available data) and Abstracts Views on Vision4Press platform.
Data correspond to usage on the plateform after 2015. The current usage metrics is available 48-96 hours after online publication and is updated daily on week days.
Initial download of the metrics may take a while.