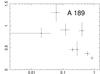
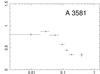
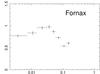
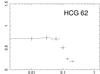
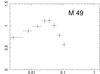
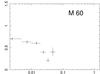
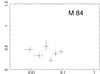
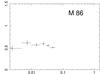
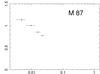
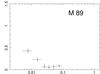
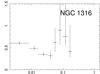
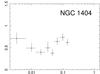
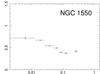
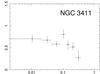
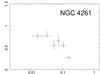
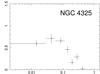
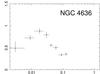
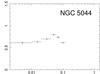
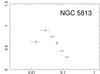
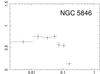
Fig. A.2

Radial Fe abundance profiles for all the groups/ellipticals (kTmean< 1.7 keV) in our sample. The radial distances (x-axis) are expressed in fractions of r500 while the Fe abundances (y-axis) are given with respect to their proto-solar values (Lodders et al. 2009). Data points that were not included when computing the average profile were removed (Sect. 4.1).

Current usage metrics show cumulative count of Article Views (full-text article views including HTML views, PDF and ePub downloads, according to the available data) and Abstracts Views on Vision4Press platform.
Data correspond to usage on the plateform after 2015. The current usage metrics is available 48-96 hours after online publication and is updated daily on week days.
Initial download of the metrics may take a while.