Fig. 14
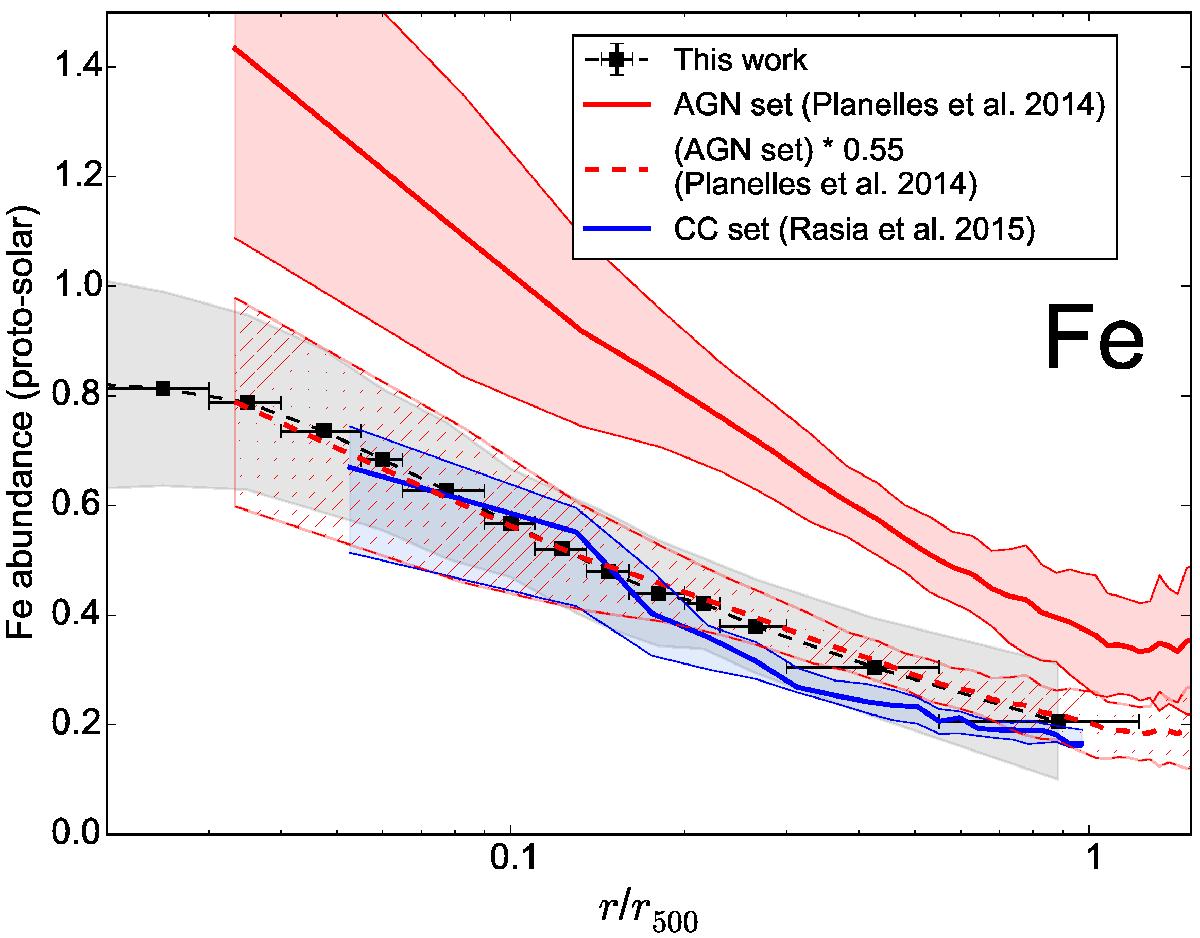
Comparison between our average Fe measured radial profile (Fig. 1) and predictions from hydrodynamical simulations from Planelles et al. (2014, solid red lines) and Rasia et al. (2015, solid blue lines), both modelling AGN feedback effects on the chemical enrichment. The red dashed lines show the same simulation set from Planelles et al. (2014) with a normalisation rescaled by a factor of 0.55.
Current usage metrics show cumulative count of Article Views (full-text article views including HTML views, PDF and ePub downloads, according to the available data) and Abstracts Views on Vision4Press platform.
Data correspond to usage on the plateform after 2015. The current usage metrics is available 48-96 hours after online publication and is updated daily on week days.
Initial download of the metrics may take a while.