Fig. 7
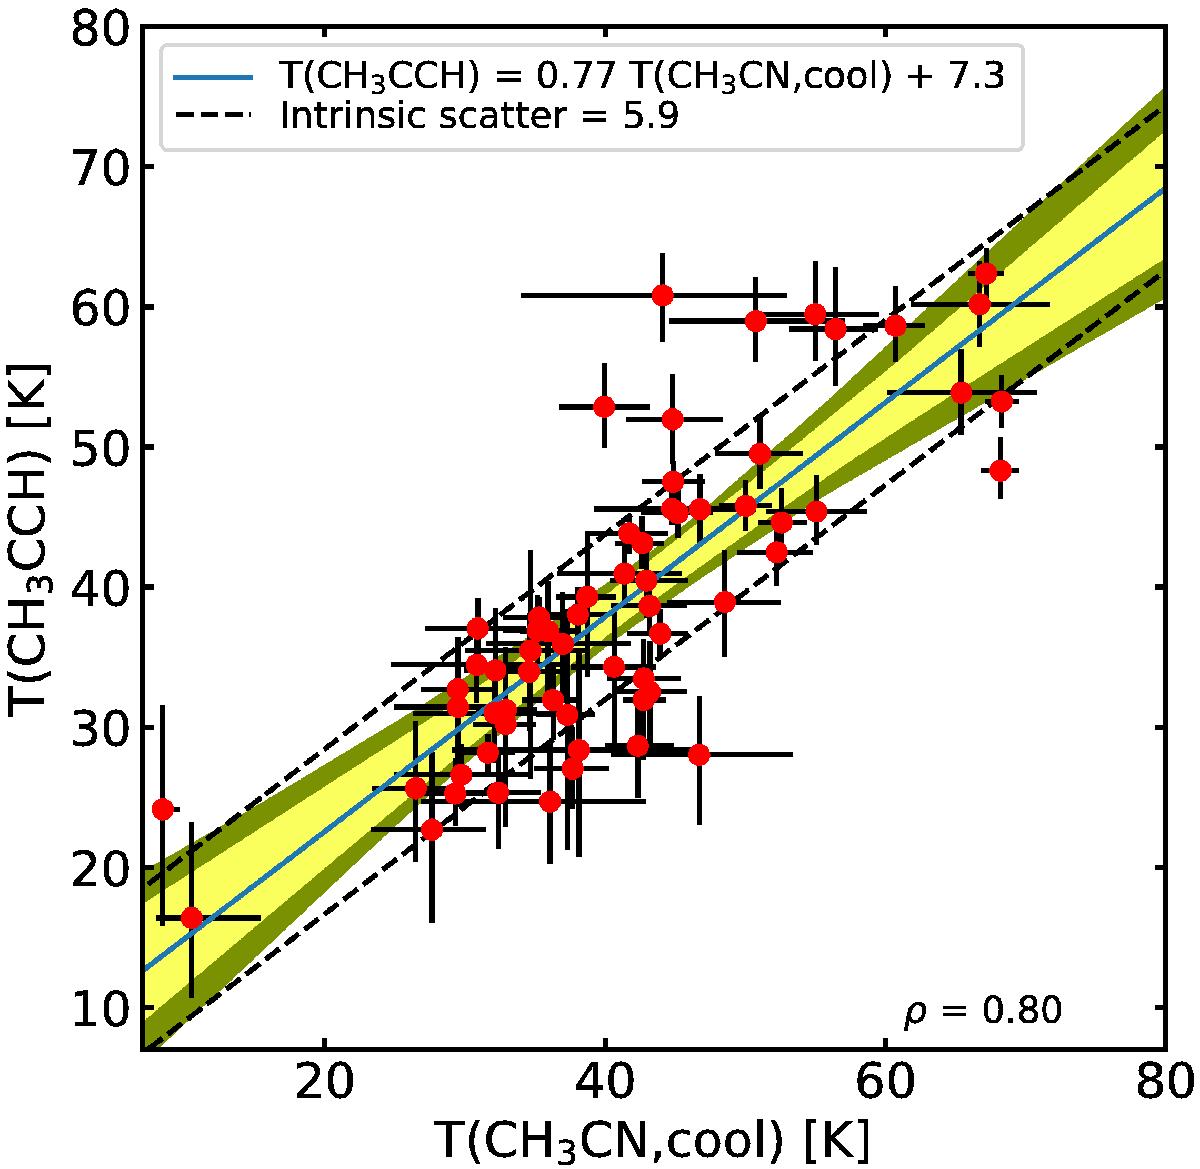
Correlation between the temperature as measured by CH3CN and CH3CCH. All the other combinations between the tracers analysed are included in the online material in Fig. A. The best fit is shown as a blue solid line. The uncertainties due to the line parameters are indicated by the shaded region – dark- and light yellow for 68% and 95% HPD intervals, respectively. The intrinsic scatter in the relation is indicated by the dashed black lines. At the bottom right of the panels the Spearman correlation coefficient is indicated.
Current usage metrics show cumulative count of Article Views (full-text article views including HTML views, PDF and ePub downloads, according to the available data) and Abstracts Views on Vision4Press platform.
Data correspond to usage on the plateform after 2015. The current usage metrics is available 48-96 hours after online publication and is updated daily on week days.
Initial download of the metrics may take a while.