Fig. 5
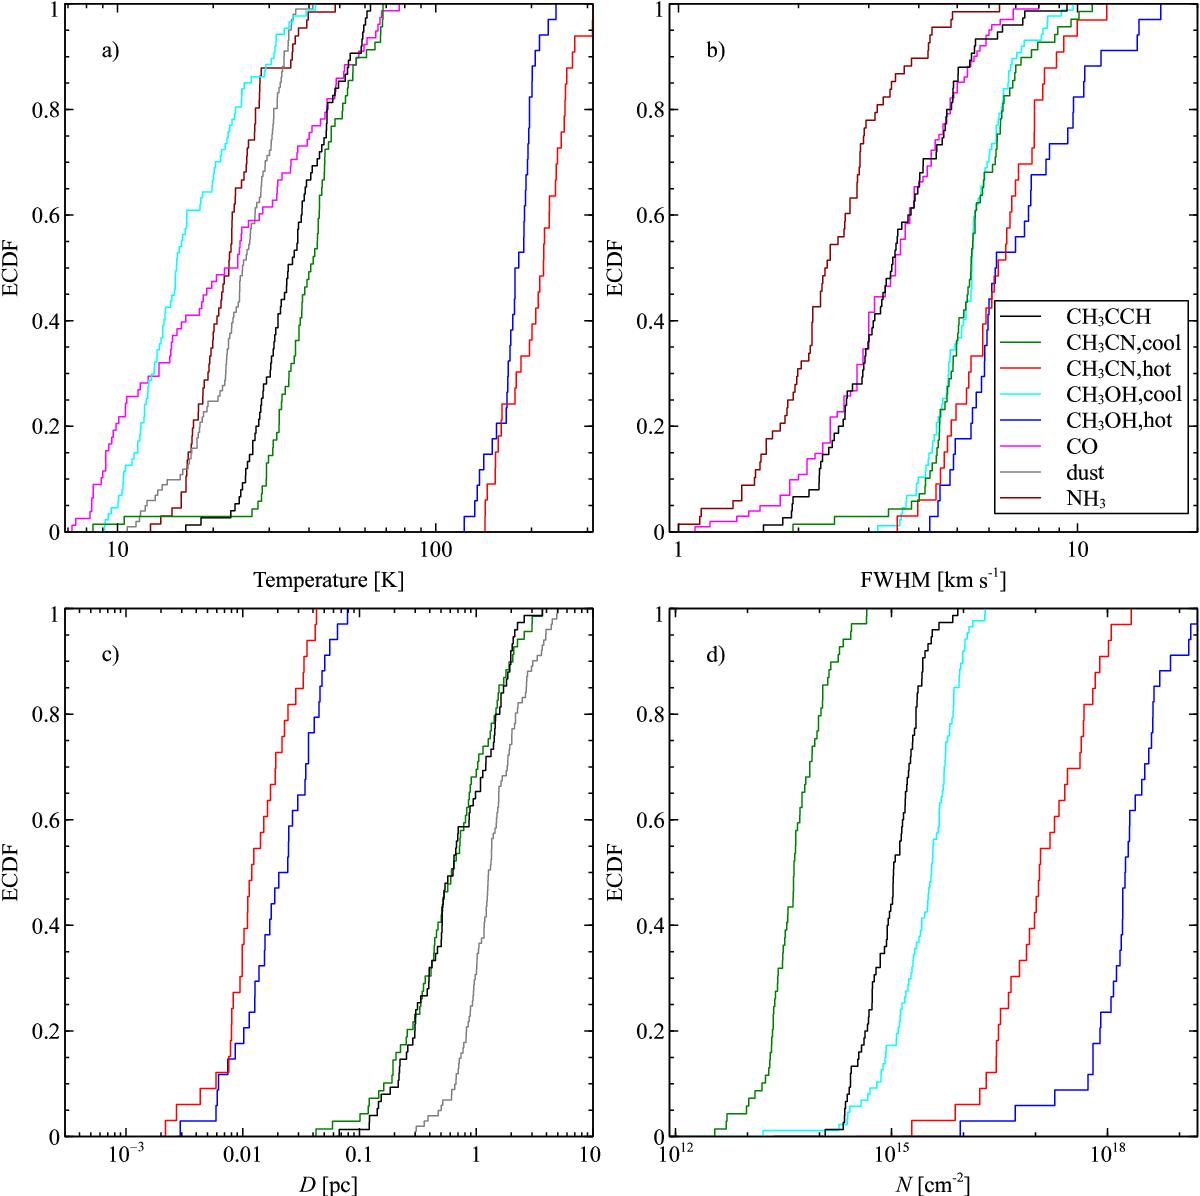
Empirical cumulative distribution functions for a) temperatures, b) line FWHMs, c) source diameter, and d) molecular column density. The different tracers and components are drawn with different colours, as indicated in the legend in the lower right corner of panel b). “CO” refers to properties obtained from C17O and C18O transitions from Giannetti et al. (2014), and NH3 properties are taken from Wienen et al. (2012). Dust properties from König et al. (2017) are included only in panels a) and c).
Current usage metrics show cumulative count of Article Views (full-text article views including HTML views, PDF and ePub downloads, according to the available data) and Abstracts Views on Vision4Press platform.
Data correspond to usage on the plateform after 2015. The current usage metrics is available 48-96 hours after online publication and is updated daily on week days.
Initial download of the metrics may take a while.