Fig. 4
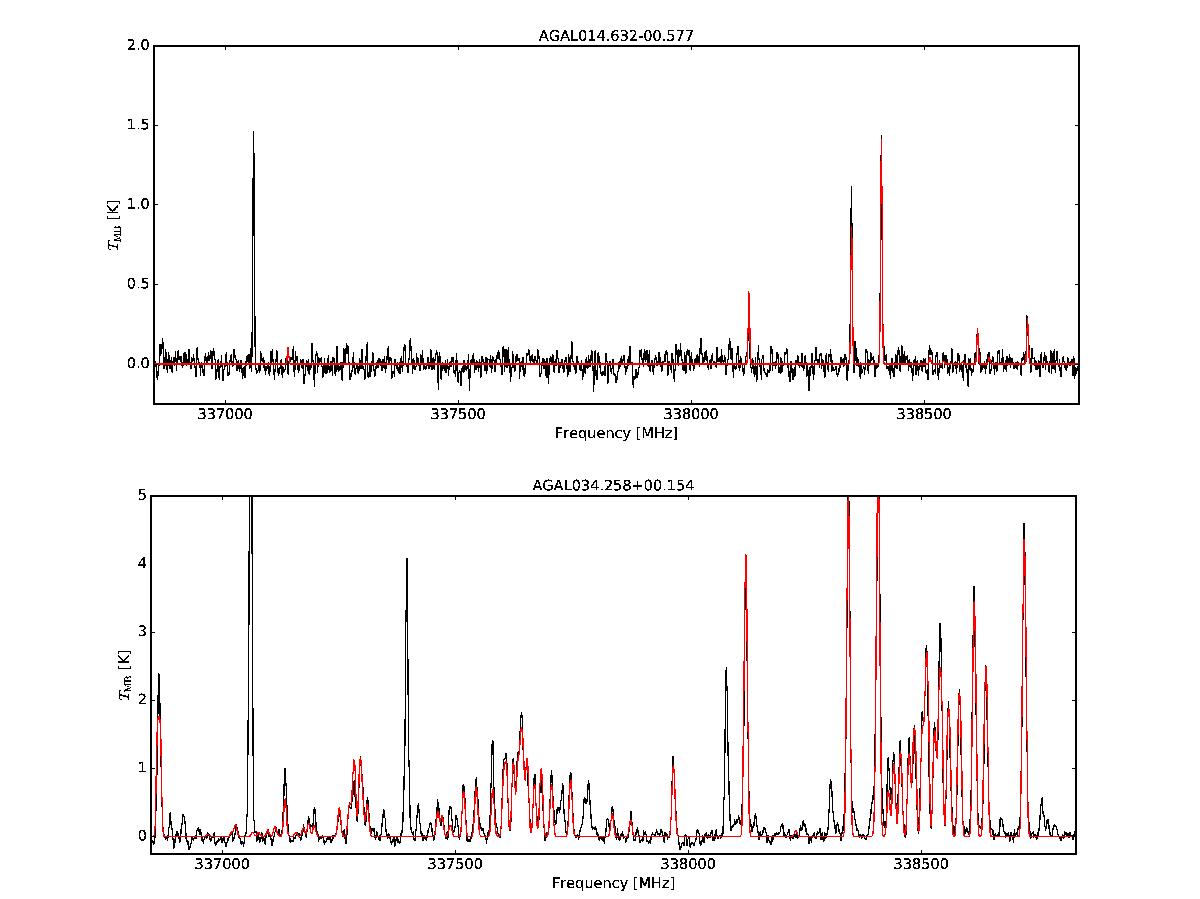
Example of the fit performed with MCWeeds for CH3OH. The best fit model is shown in red. The lines not reproduced by the model are contaminating species and are excluded from the spectral ranges used for the fit (cf. Table 2) The top panel show the results for an IRw source and the bottom panel for an Hii. The νt = 1 band is visible between ~ 337 500 and ~380 000 MHz.
Current usage metrics show cumulative count of Article Views (full-text article views including HTML views, PDF and ePub downloads, according to the available data) and Abstracts Views on Vision4Press platform.
Data correspond to usage on the plateform after 2015. The current usage metrics is available 48-96 hours after online publication and is updated daily on week days.
Initial download of the metrics may take a while.