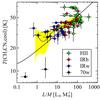
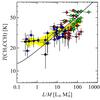
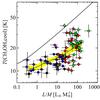
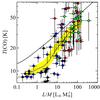
Fig. 10
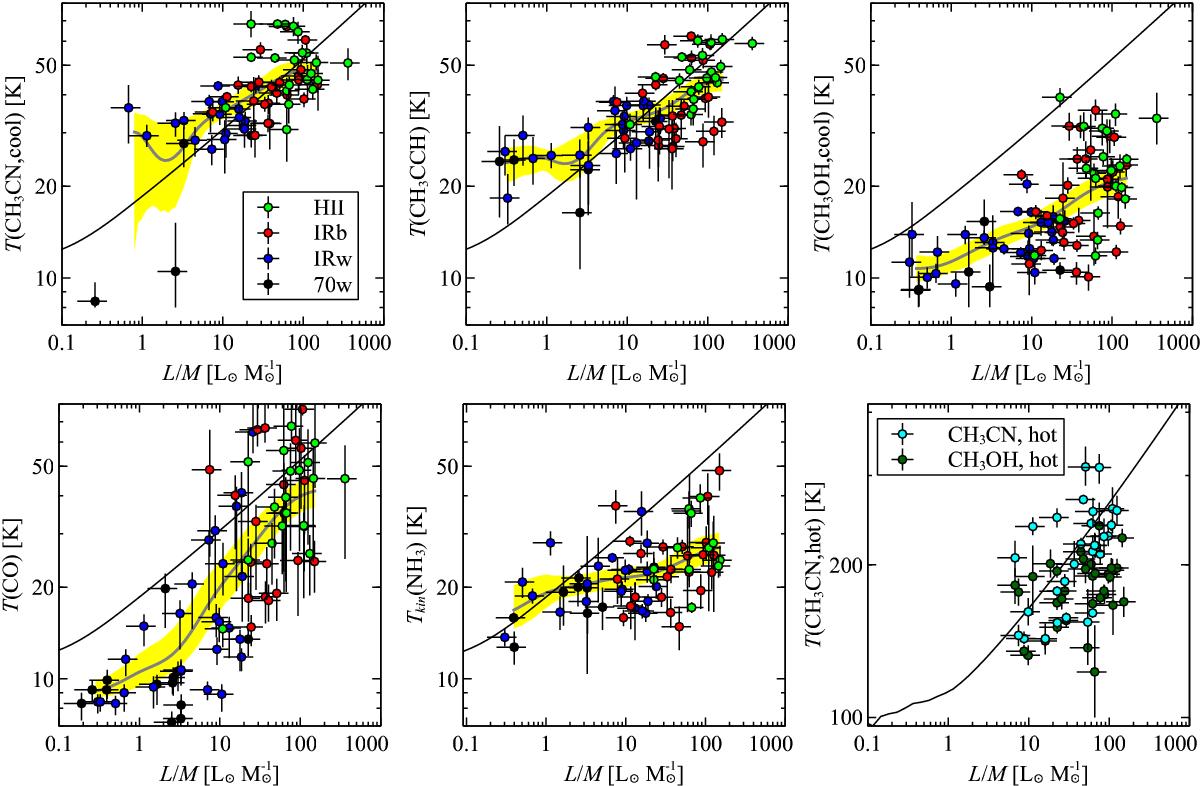
L/M ratio vs. temperature. The black solid line indicates the line-of-sight- and beam-averaged temperature for a spherical clump model passively heated by a central object accounting for the total luminosity. The thick grey line shows the non-parametric regression of the data, with uncertainties indicated by the yellow-shaded area.
Current usage metrics show cumulative count of Article Views (full-text article views including HTML views, PDF and ePub downloads, according to the available data) and Abstracts Views on Vision4Press platform.
Data correspond to usage on the plateform after 2015. The current usage metrics is available 48-96 hours after online publication and is updated daily on week days.
Initial download of the metrics may take a while.