Fig. 6
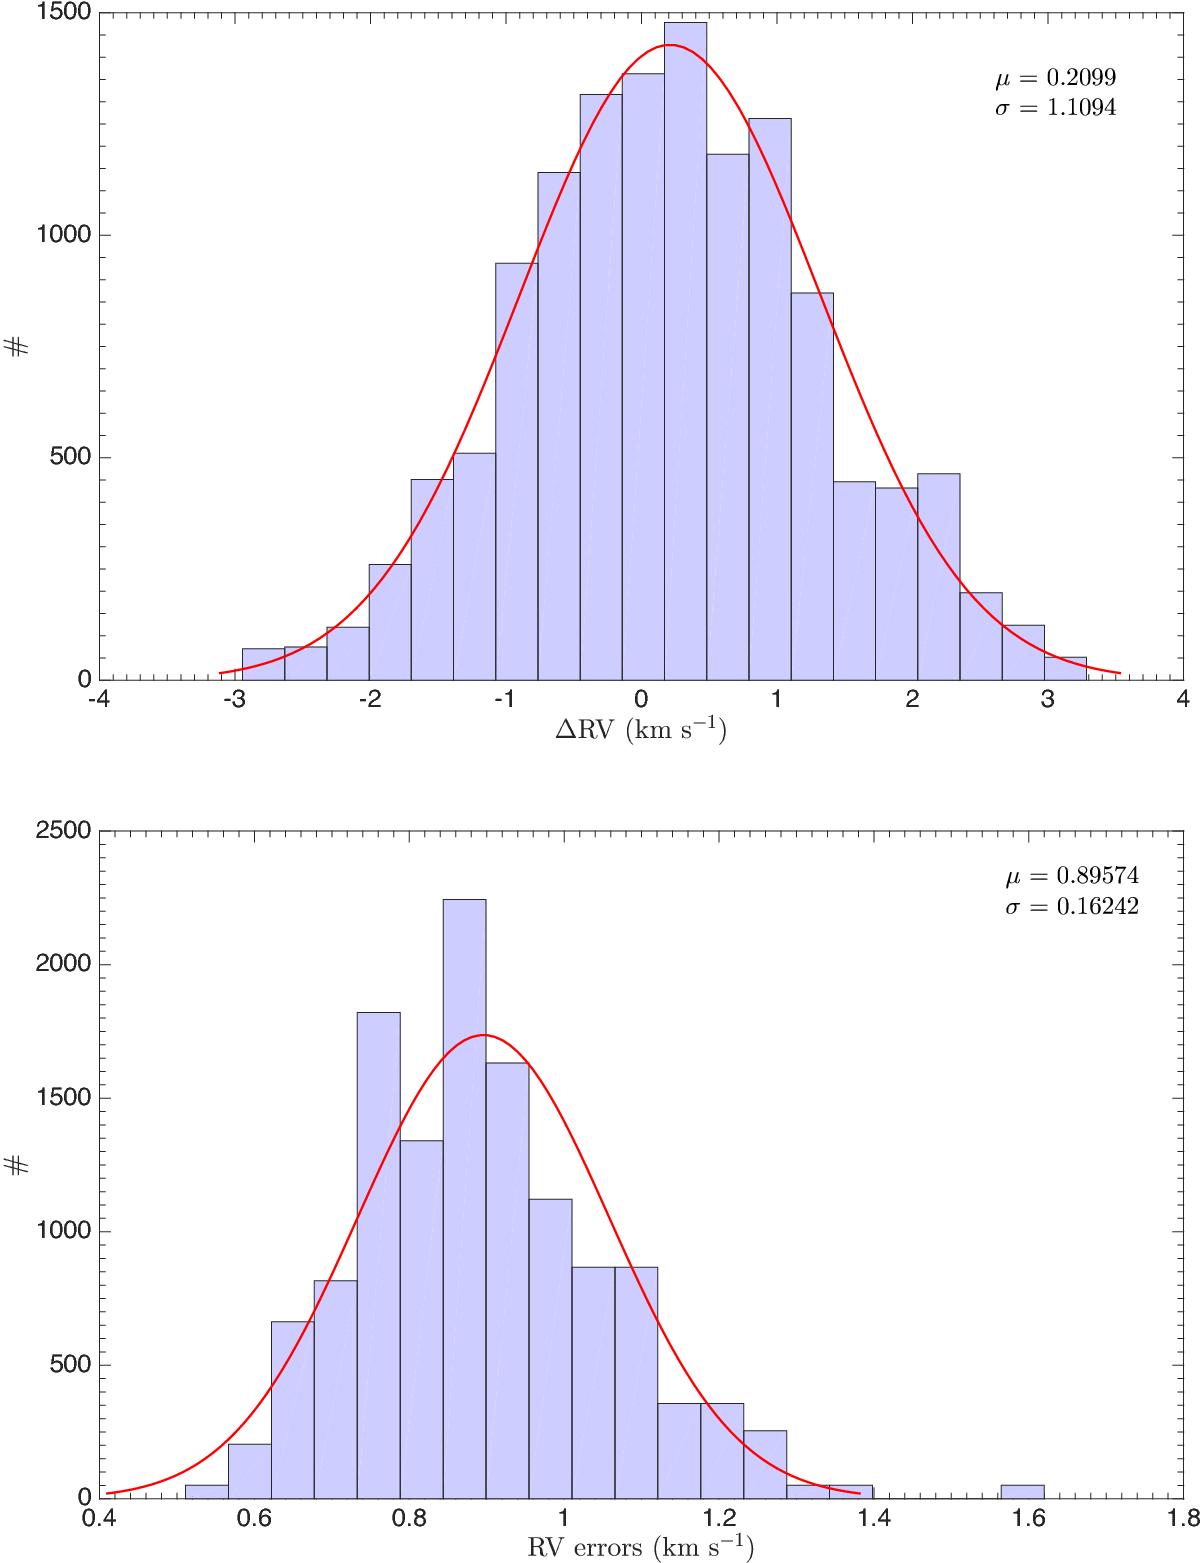
Example of Monte Carlo simulations for a B0.5 V star with vsin i = 400 km s-1 observed with R = 50 000. A total of 12 750 trials were made. Upper panel: deviations of the derived velocities with respect to the input values. Lower panel: breakdown of the derived errors provided by RVSAO. The Gaussian that best represents each distribution is overplotted in red.
Current usage metrics show cumulative count of Article Views (full-text article views including HTML views, PDF and ePub downloads, according to the available data) and Abstracts Views on Vision4Press platform.
Data correspond to usage on the plateform after 2015. The current usage metrics is available 48-96 hours after online publication and is updated daily on week days.
Initial download of the metrics may take a while.