Free Access
Fig. 2
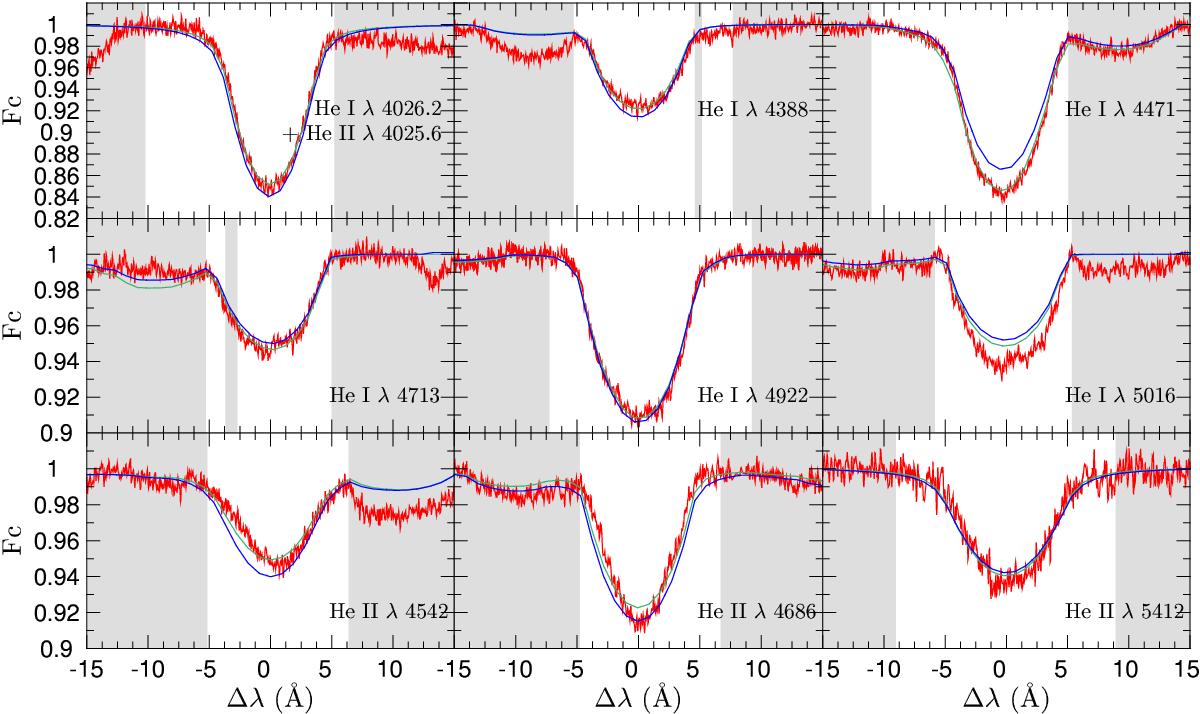
Comparison between the observed FEROS spectrum of HD 90087 (red) and the best-fitting synthetic He line profiles (green). The line profiles computed for the final, mean parameters are shown in blue. The white areas delineate the regions where the fit quality was evaluated.
Current usage metrics show cumulative count of Article Views (full-text article views including HTML views, PDF and ePub downloads, according to the available data) and Abstracts Views on Vision4Press platform.
Data correspond to usage on the plateform after 2015. The current usage metrics is available 48-96 hours after online publication and is updated daily on week days.
Initial download of the metrics may take a while.