Fig. 11
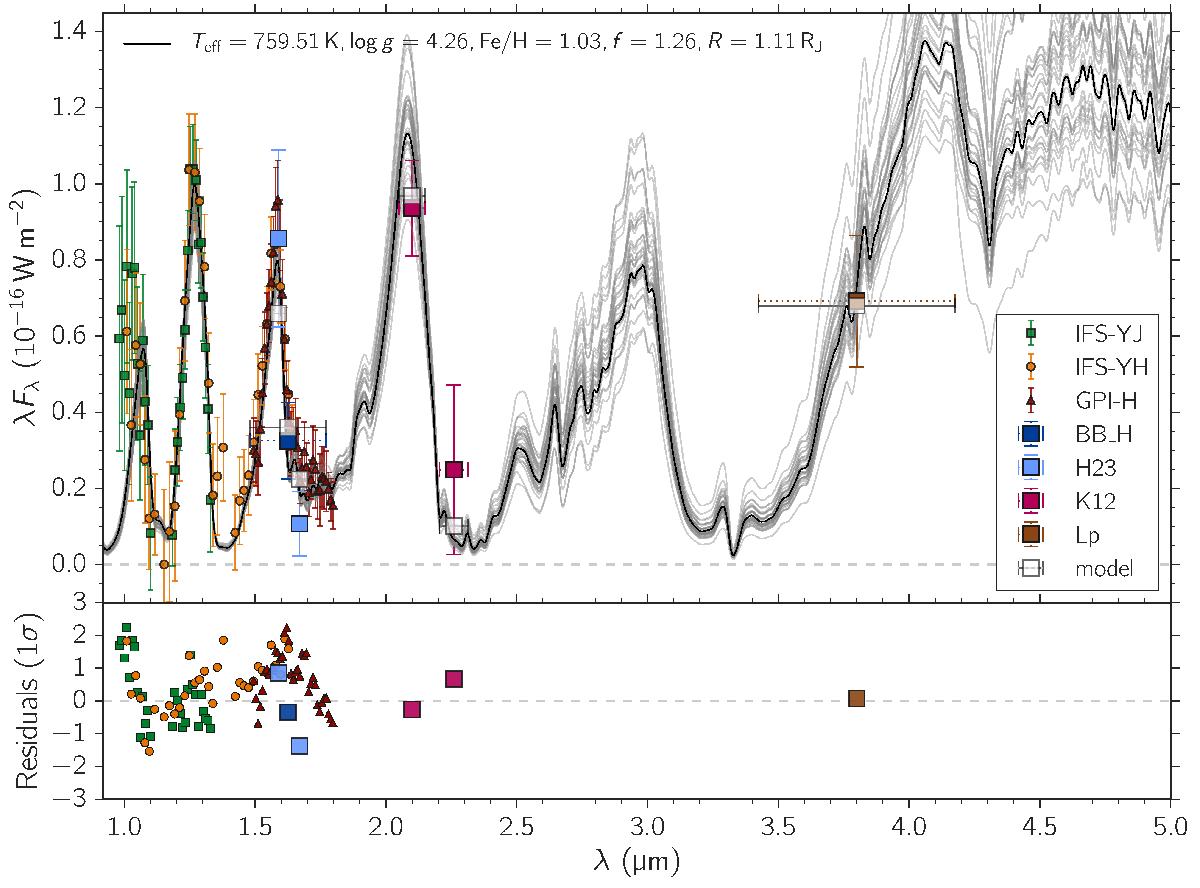
petitCODE cloudy model interpolated to the parameters best describing the data according to the posterior probability distribution (black line), as well as the SPHERE spectrophotometric data, GPI H-band spectrum, and L′ data point from Macintosh et al. (2015). For photometric data points, the x-error bar reflects the filter width rather than uncertainties. The gray lines represent 32 randomly drawn samples from the posterior probability distribution to reflect the spread of plausible model parameter combinations that fit the data. Photometric points describe the average flux in the respective filter, whereas the orange points describe the average flux in the respective filter for the best fitting model. The residuals are shown in multiples of 1σ uncertainties of the data.
Current usage metrics show cumulative count of Article Views (full-text article views including HTML views, PDF and ePub downloads, according to the available data) and Abstracts Views on Vision4Press platform.
Data correspond to usage on the plateform after 2015. The current usage metrics is available 48-96 hours after online publication and is updated daily on week days.
Initial download of the metrics may take a while.