Fig. 1
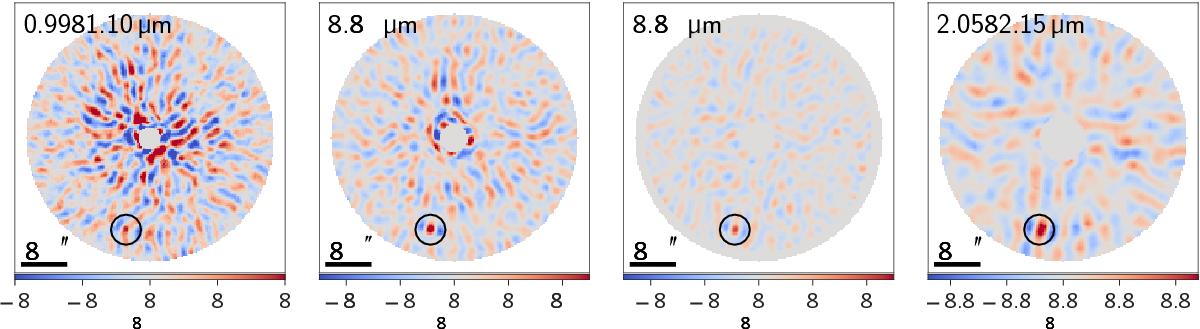
S/N maps created by ANDROMEDA for IFS and IRDIS K1. The maps are in order of ascending wavelength. The first two are extracted from the YJ-IFS data and the third from the YH-IFS data. The Y-band image (left) shows the median combined map between 0.99–1.10 μm as S/N is low, whereas the second and third image, which correspond to the peak in J and H, show single channels. The right panel shows the IRDIS K1 filter. Standard astronomical orientation is used, where up is north and left is east. The black circle indicates the position of the planet. The azimuthal negative wings around the planet signal is the characteristic planet signature that ANDROMEDA is fitting for in ADI data and not undesirable self-subtraction as in the PCA/LOCI approach (Cantalloube et al. 2015).
Current usage metrics show cumulative count of Article Views (full-text article views including HTML views, PDF and ePub downloads, according to the available data) and Abstracts Views on Vision4Press platform.
Data correspond to usage on the plateform after 2015. The current usage metrics is available 48-96 hours after online publication and is updated daily on week days.
Initial download of the metrics may take a while.