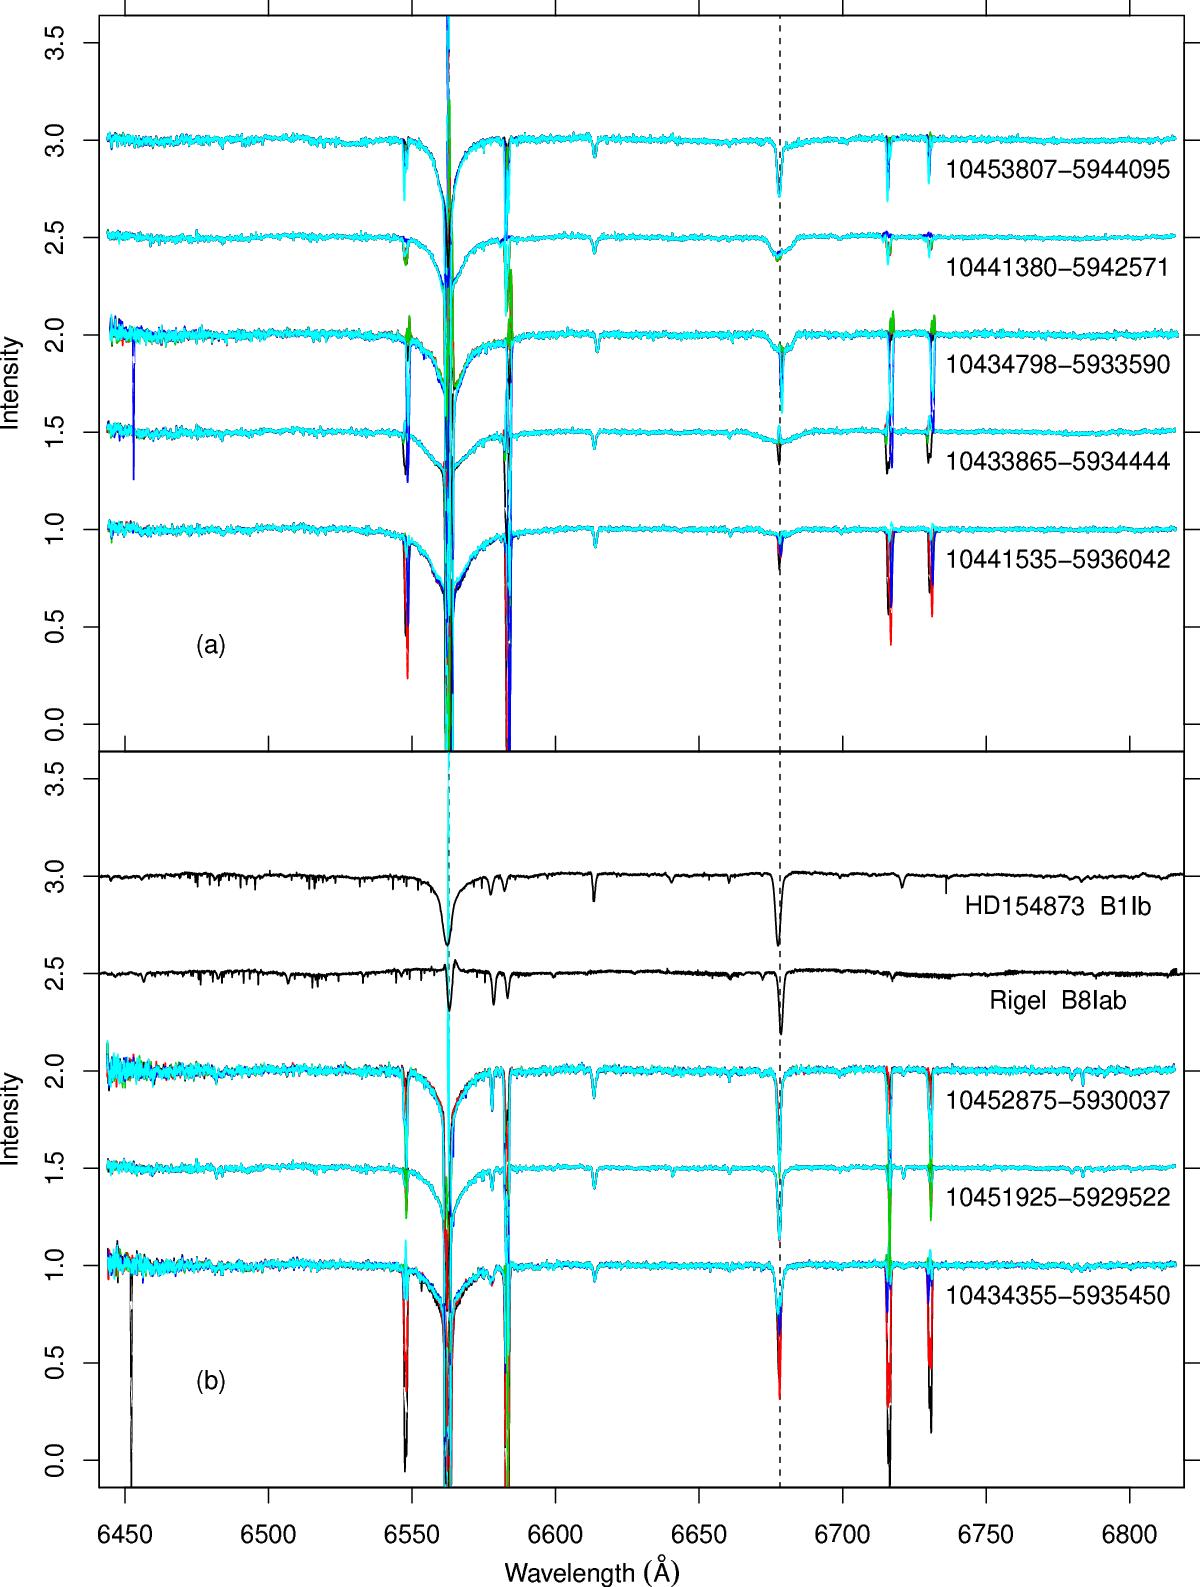
Fig. 6

Top a) example spectra of B stars found among our targets. For each star, five spectra are overplotted with different colors, corresponding to five distinct options regarding nebular subtraction. The vertical dashed black line indicates the He I 6678 Å line, distinctive of B stars, but also coincident with a strong, narrow nebular line. Spectra of different stars are offset by 0.5 for clarity. The narrow absorption feature near 6613 Å is a well-known DIB, while a weakerDIB is sometimes visible near 6660 Å. Bottom b) spectra of sample B stars (lower three spectra) showing absorption in the C II doublet near 6580 Å (the redder line in the doublet coincides with the nebular [N II] 6584 Å line), which is typical of known B bright giants/supergiants (upper two spectra, from UVES/POP). The vertical dashed lines indicate Hα and He I 6678 Å.
Current usage metrics show cumulative count of Article Views (full-text article views including HTML views, PDF and ePub downloads, according to the available data) and Abstracts Views on Vision4Press platform.
Data correspond to usage on the plateform after 2015. The current usage metrics is available 48-96 hours after online publication and is updated daily on week days.
Initial download of the metrics may take a while.


