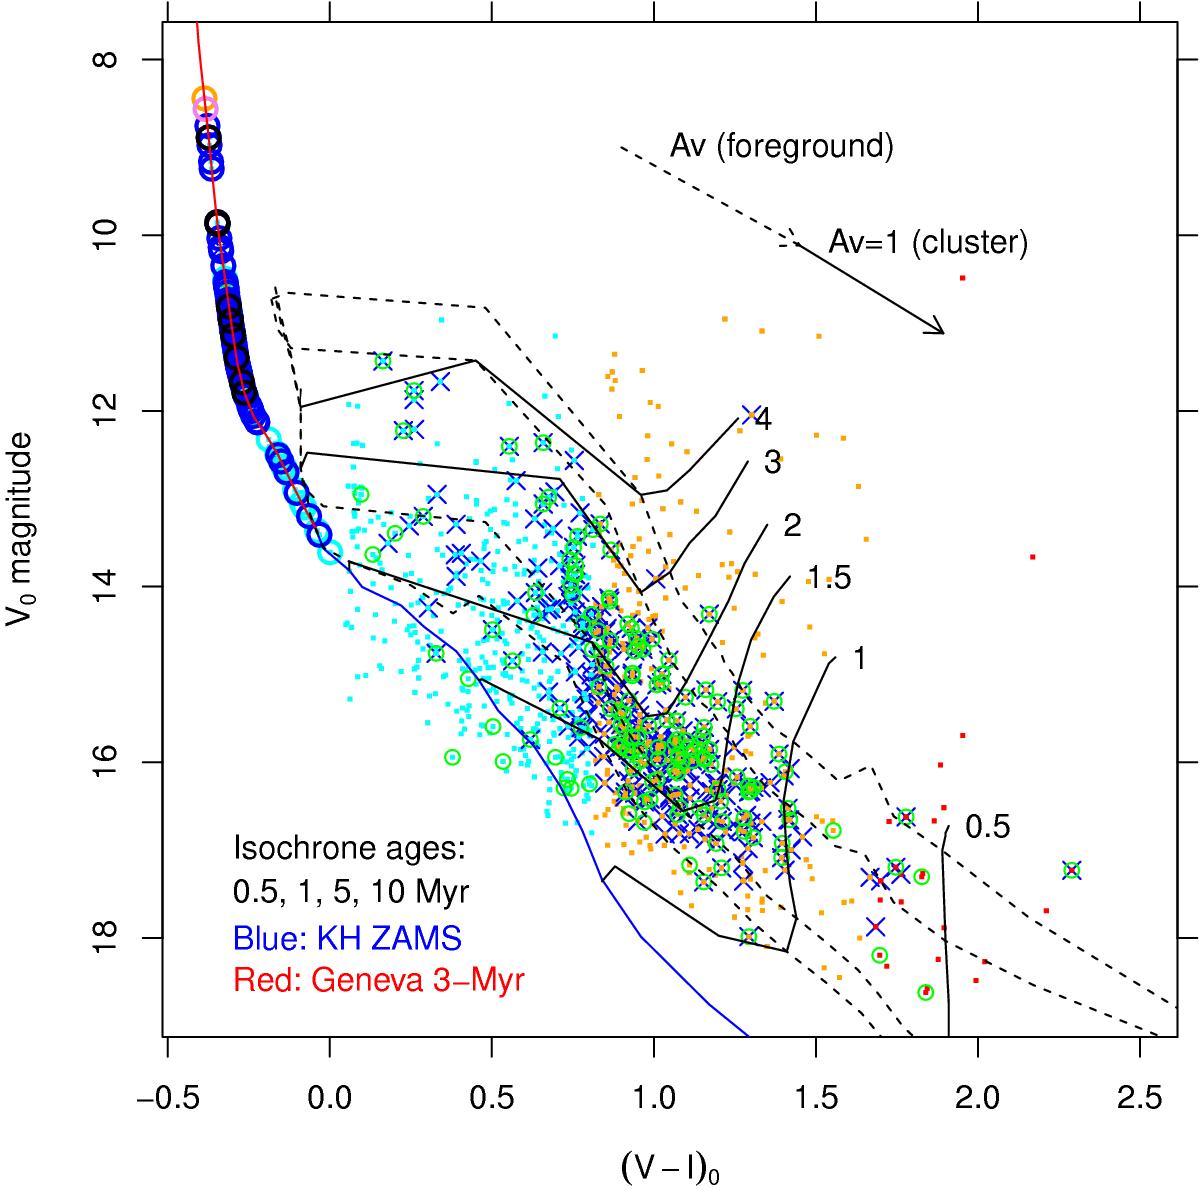
Fig. 13

Dereddened (V,V − I) color–magnitude diagram. Symbols as in Figs. 5 and 10. Also shown are the ZAMS for lower MS stars (blue), a Geneva 3-Myr isochrone for massive stars (red), and selected isochrones (dashed black) and evolutionary tracks (solid black) for lower mass stars from Siess et al. (2000); these latter are labeled with stellar mass in solar units. The A0 and earlier type stars have been projected to the MS (along the combined foreground + cluster reddening vector, as shown), since they lack a detailed classification.
Current usage metrics show cumulative count of Article Views (full-text article views including HTML views, PDF and ePub downloads, according to the available data) and Abstracts Views on Vision4Press platform.
Data correspond to usage on the plateform after 2015. The current usage metrics is available 48-96 hours after online publication and is updated daily on week days.
Initial download of the metrics may take a while.


