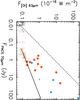
Fig. 16
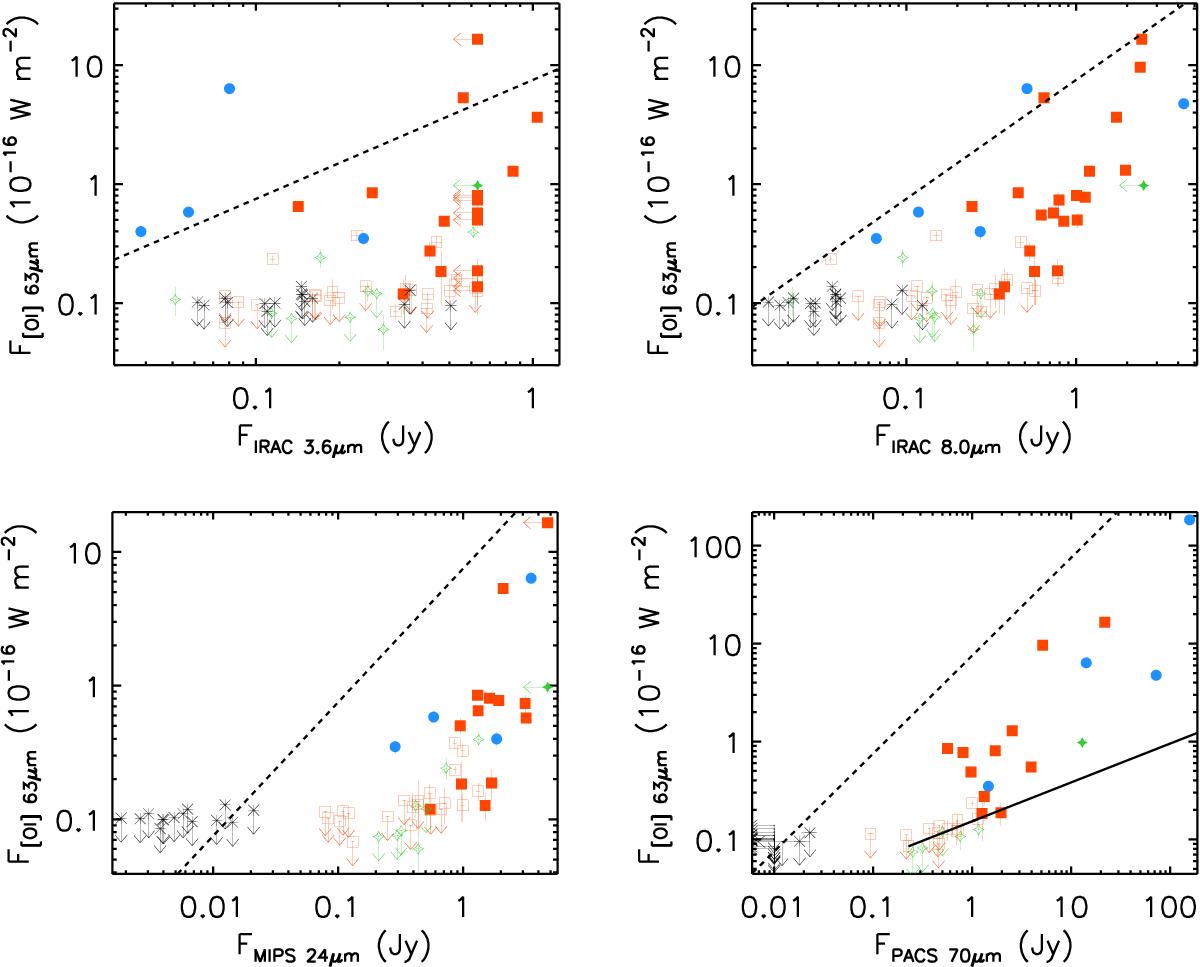
[OI] 63.18 μm flux versus: IRAC 3.6 μm (top left); IRAC 8.0 μm (top right); MIPS 24 μm (bottom left); and PACS 70 μm (bottom right) continuum fluxes. Class I, Class II, Class III, and transition discs (TD) are represented by circles (blue), squares (red), asterisks (black), and stars (green), respectively. Filled symbols corresponds to outflow sources. Arrows indicate upper limits. The dashed lines are 1:1 relations and the solid line is a fit to disc sources as explained in the text.
Current usage metrics show cumulative count of Article Views (full-text article views including HTML views, PDF and ePub downloads, according to the available data) and Abstracts Views on Vision4Press platform.
Data correspond to usage on the plateform after 2015. The current usage metrics is available 48-96 hours after online publication and is updated daily on week days.
Initial download of the metrics may take a while.