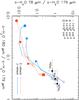
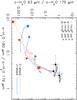
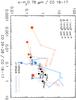
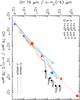
Fig. 15
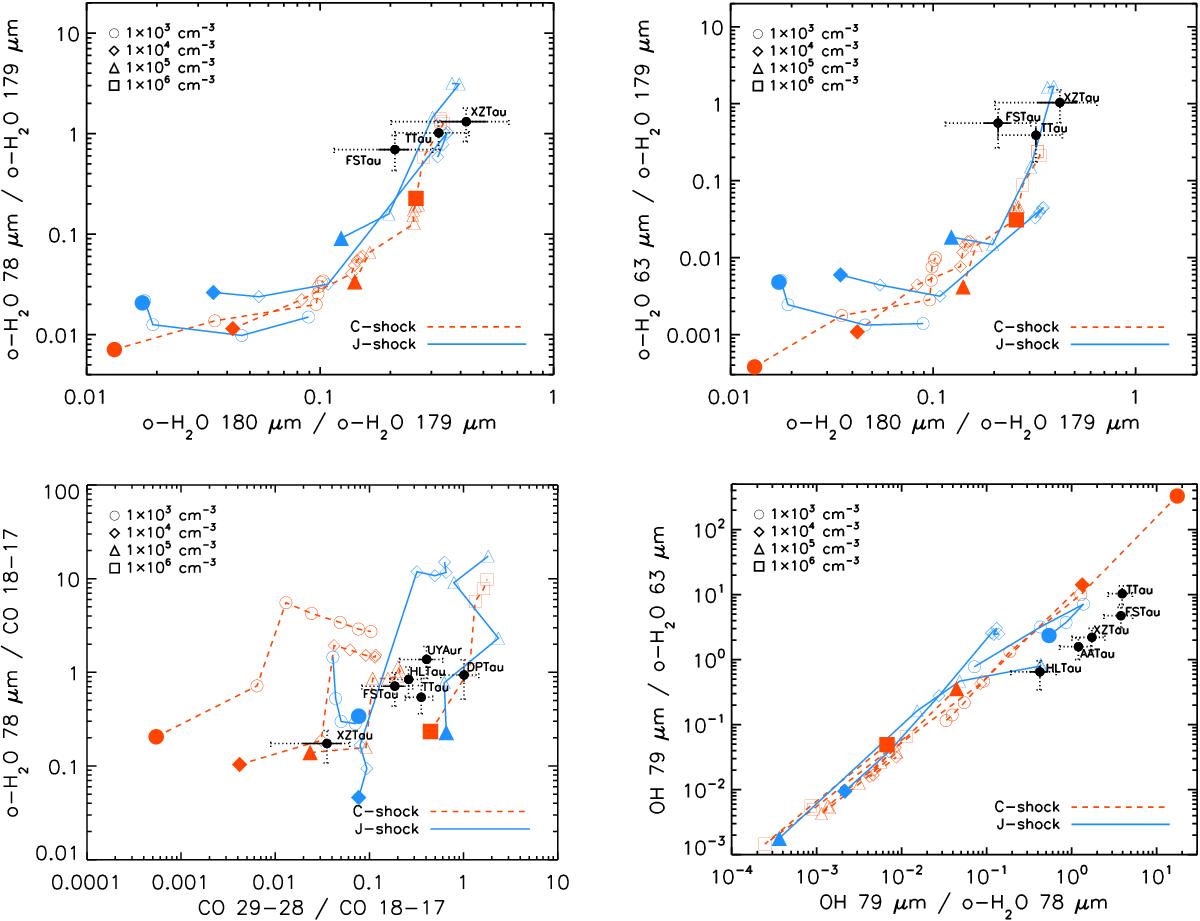
Observed molecular line ratios compared with C-type (red dashed lines) and J-type (blue lines) model predictions from Flower & Pineau des Forêts (2015). The circles, diamonds, triangles, and squares correspond to pre-shock densities of 103 cm-3, 104 cm-3, 105 cm-3, and 106 cm-3, respectively, with shock velocities (Vshock) from 10 km s-1 to 40 km s-1 (C-type) or from 10 km s-1 to 30 km s-1 (J-type). Filled symbols indicate the position of the lowest velocity (Vshock=10 km s-1). Black filled circles represent detections and arrows are upper limits. Solid error bars are the intrinsic errors of the line fluxes and dotted error bars are obtained by adding a 30% error due to the PACS flux calibration.
Current usage metrics show cumulative count of Article Views (full-text article views including HTML views, PDF and ePub downloads, according to the available data) and Abstracts Views on Vision4Press platform.
Data correspond to usage on the plateform after 2015. The current usage metrics is available 48-96 hours after online publication and is updated daily on week days.
Initial download of the metrics may take a while.