Fig. 14
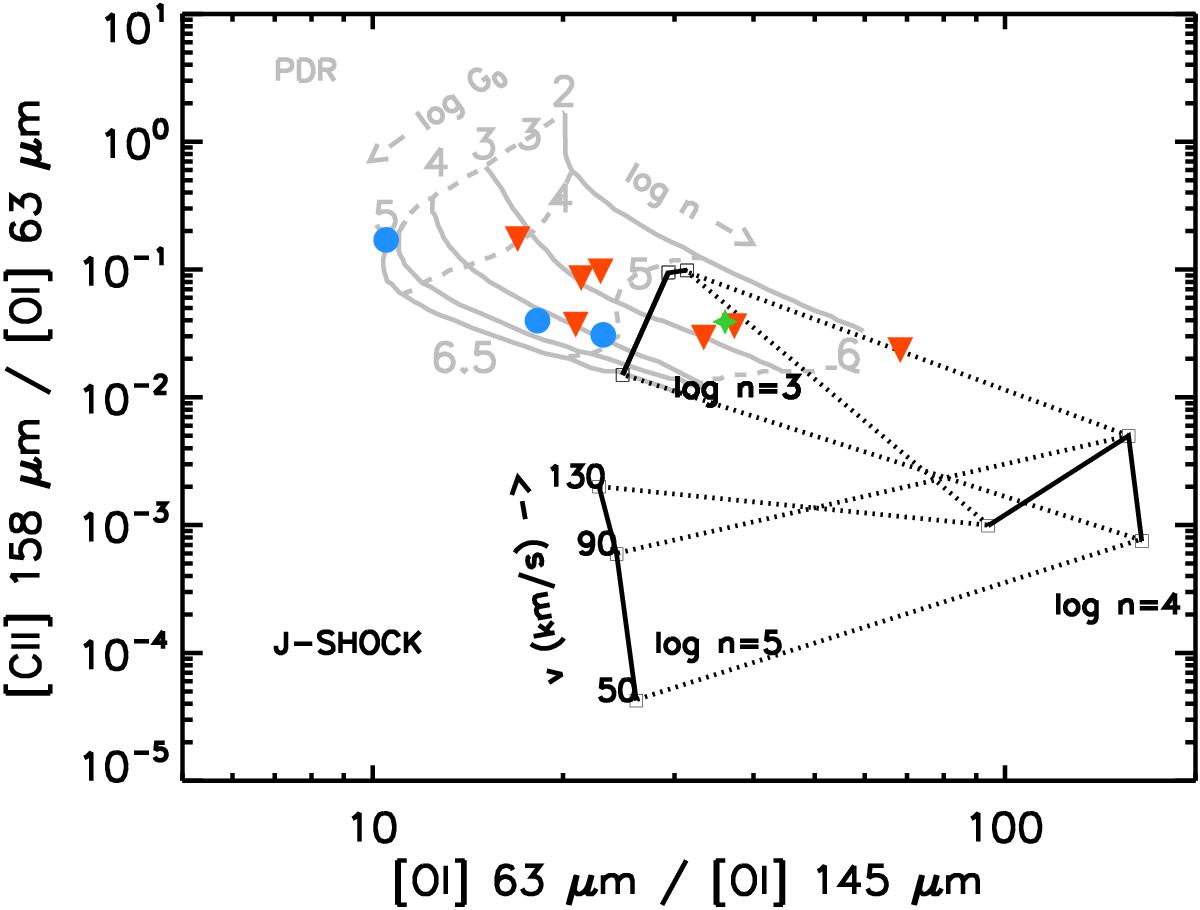
Observed [OI]63/[OI]145 and [OI]63/[CII]158 line flux ratios plotted as a function of different emitting conditions. The PDR models (grey) are from Kaufman et al. (1999); and J-shock models (black) from Hollenbach & McKee (1989). For the PDR models, the labels indicate the gas density (n) and the intensity of the FUV field (G0), respectively. For the shock models, the labels denote pre-shock densities (n) and shock speeds (Vshock). The data is plotted according to their SED class: blue circles are Class I, red triangles are Class II, and green stars are TD.
Current usage metrics show cumulative count of Article Views (full-text article views including HTML views, PDF and ePub downloads, according to the available data) and Abstracts Views on Vision4Press platform.
Data correspond to usage on the plateform after 2015. The current usage metrics is available 48-96 hours after online publication and is updated daily on week days.
Initial download of the metrics may take a while.