Fig. 13
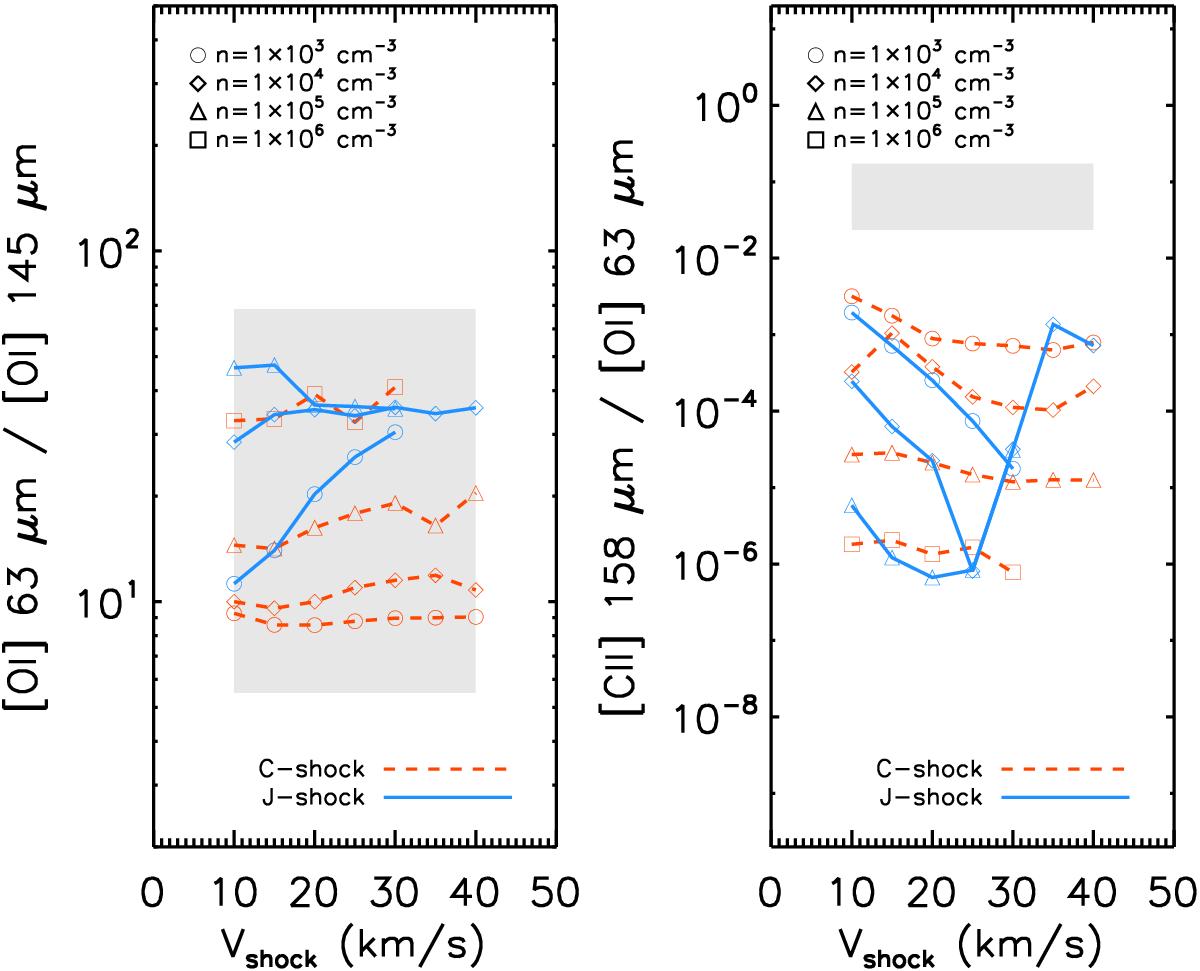
Observed atomic line ratios compared to C-type (red dashed lines) and J-type (blue lines) shock model predictions from Flower & Pineau des Forêts (2015) for shock velocities (Vshock) between 10 and 40 km s-1. The circles, diamonds, triangles, and squares correspond to pre-shock densities (n) of 103 cm-3, 104 cm-3, 105 cm-3, and 106 cm-3, respectively. The range of the observed atomic ratios is represented by the shaded region.
Current usage metrics show cumulative count of Article Views (full-text article views including HTML views, PDF and ePub downloads, according to the available data) and Abstracts Views on Vision4Press platform.
Data correspond to usage on the plateform after 2015. The current usage metrics is available 48-96 hours after online publication and is updated daily on week days.
Initial download of the metrics may take a while.