Free Access
Fig. 6
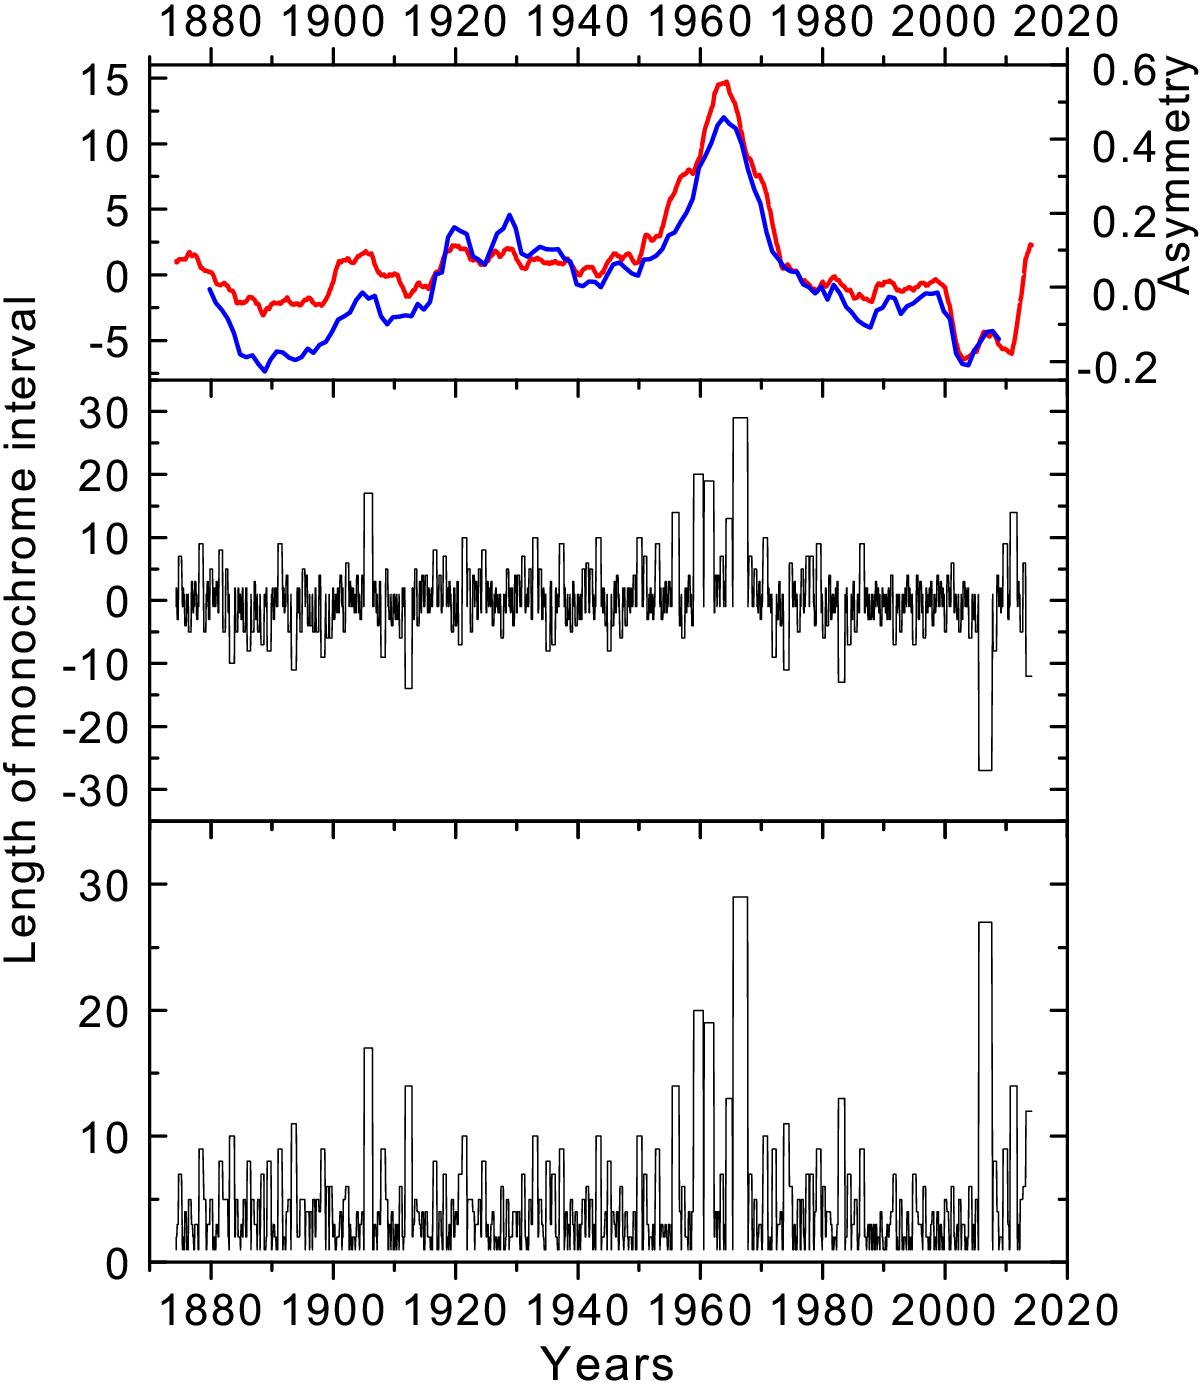
Top – the asymmetry with sign (blue curve) and the lengths of monochrome intervals (red curve) smoothed over 132-month moving window; middle and bottom – the lengths of monochrome intervals with and without regard for the sign, respectively.
Current usage metrics show cumulative count of Article Views (full-text article views including HTML views, PDF and ePub downloads, according to the available data) and Abstracts Views on Vision4Press platform.
Data correspond to usage on the plateform after 2015. The current usage metrics is available 48-96 hours after online publication and is updated daily on week days.
Initial download of the metrics may take a while.