Free Access
Fig. 5
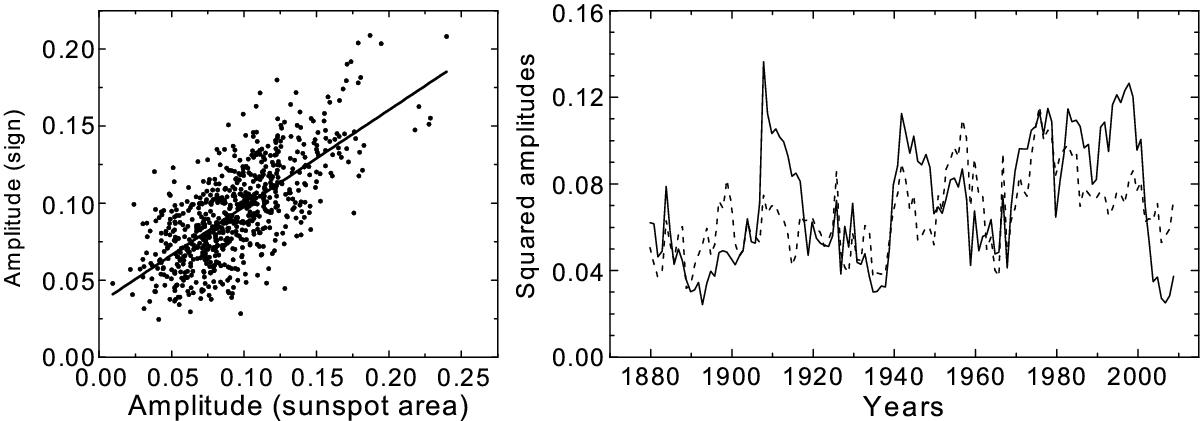
Correlation between the maps shown in Fig. 4 in the range of the periods from six to 40 months (left) and time variation of the squared amplitudes for the asymmetry and its sign in the QBO range (right).
Current usage metrics show cumulative count of Article Views (full-text article views including HTML views, PDF and ePub downloads, according to the available data) and Abstracts Views on Vision4Press platform.
Data correspond to usage on the plateform after 2015. The current usage metrics is available 48-96 hours after online publication and is updated daily on week days.
Initial download of the metrics may take a while.