Fig. 2
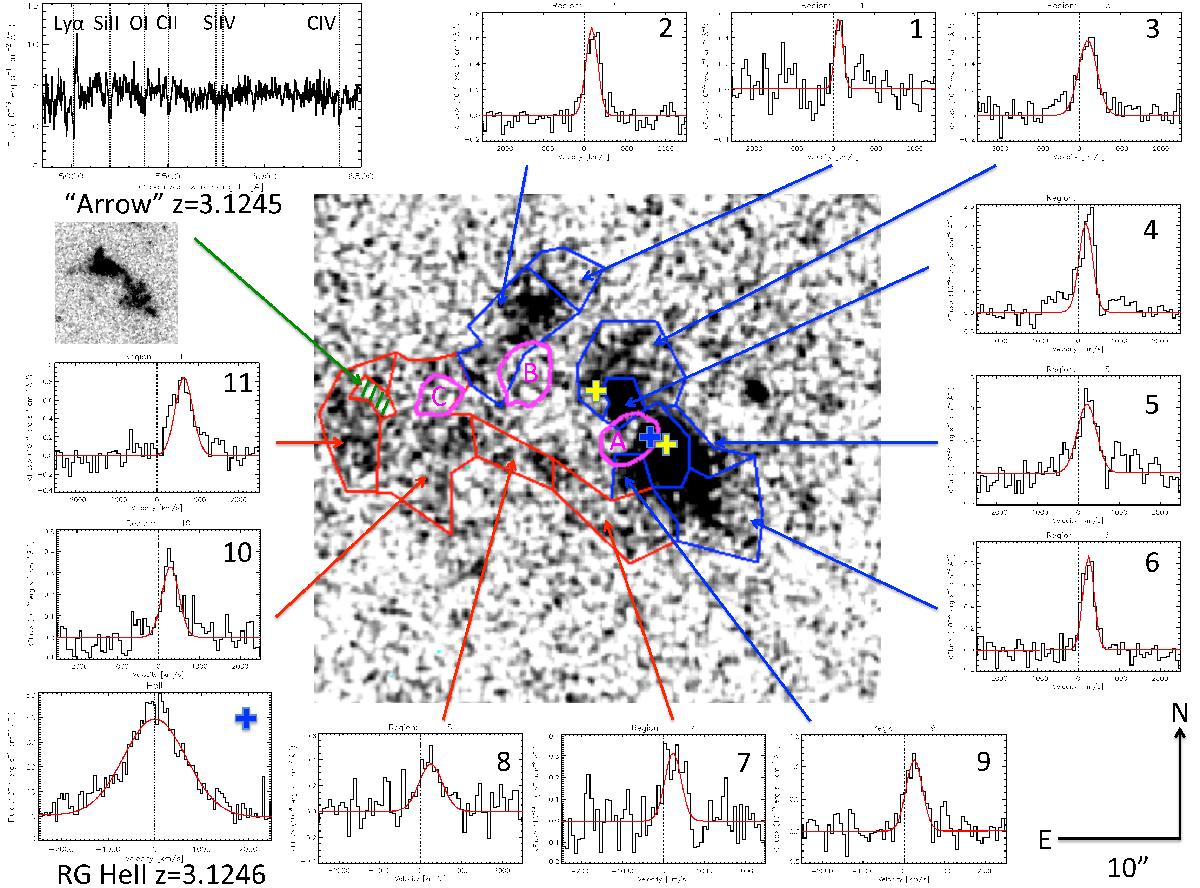
Grayscale image of the Lyα emission in MRC 0316-257 (scale and orientation at the bottom right). The red and blue lines demarcate 11 regions with their mean Lyα spectra shown in the surrounding plots. The regions bounded by blue lines are probably directly excited by the AGN, while the regions bounded by red lines indicate regions that are perhaps associated with a stream. In each of the spectral plots, we approximate the Lyα profile with the best-fit Gaussian (red). The velocity is relative to systemic (in km s-1; indicated by the black vertical line) measured from the HeII profile (bottom left). The purple contours show the region of [OII] emission for three foreground galaxies, labeled A, B, and C, whose redshifts are 0.874, 0.851, and 0.667, respectively. We indicate the positions of the radio lobes (yellow crosses) and AGN (blue cross). The top two left panels show the spectrum and HST F814W image of the “Arrow” (green hatched region in the grayscale image).
Current usage metrics show cumulative count of Article Views (full-text article views including HTML views, PDF and ePub downloads, according to the available data) and Abstracts Views on Vision4Press platform.
Data correspond to usage on the plateform after 2015. The current usage metrics is available 48-96 hours after online publication and is updated daily on week days.
Initial download of the metrics may take a while.