Fig. 6
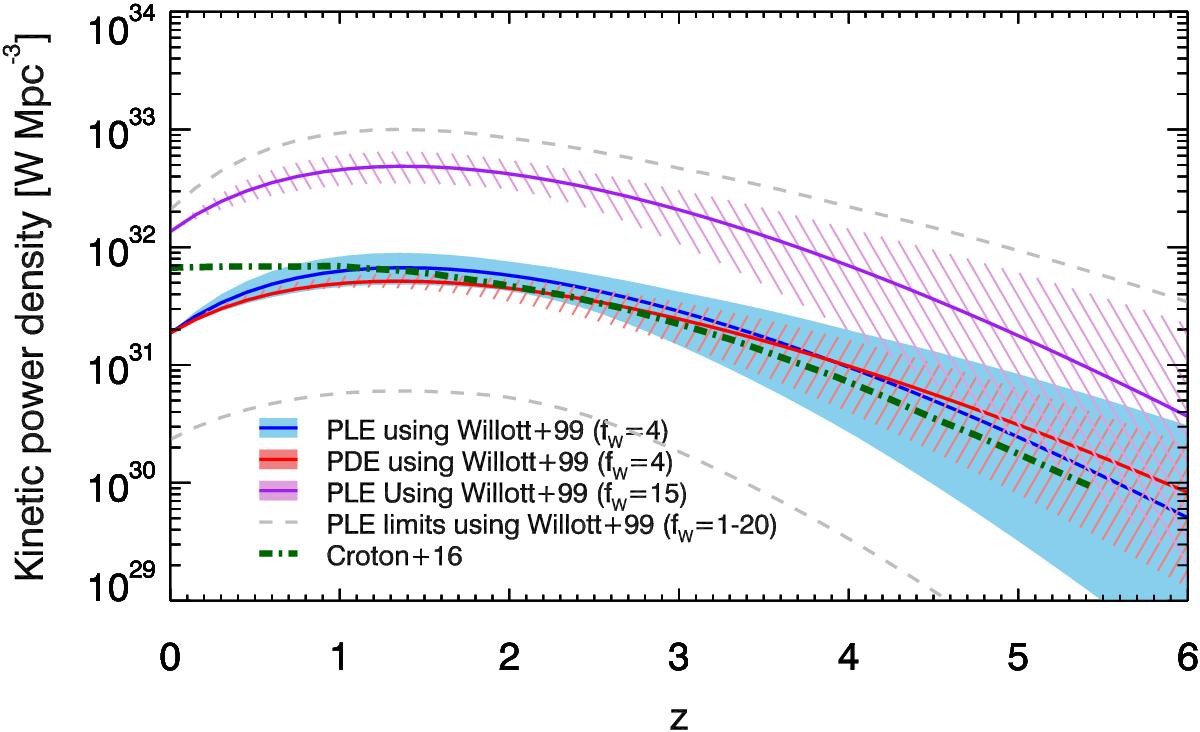
Cosmic evolution of the kinetic luminosity density for our radio AGN. The kinetic luminosity density was derived using Eq. (5), and the Willott et al. (1999) relation between monochromatic (1.4 GHz rest-frame) radio luminosity and kinetic luminosity (Eq. (4)) with fW = 4 (pure luminosity evolution, PLE, model: blue full curve and blue shaded area showing the 1σ uncertainty), fW = 15 (purple full curve, and purple-hatched area showing the 1σ uncertainty), and fW = 1, and 20, with folded 1σ fitting errors (lower and upper gray dashed curves, respectively). Also shown is the kinetic luminosity density assumed in the SAGE semi-analytic cosmological model (green dash-dotted curve; Croton et al. 2016). For comparison, the evolution of the kinetic luminosity density for our radio AGN for the pure density evolution, PDE, model using only fW = 4 (Eq. (A.1)) is also shown with the red full curve and red hatched area. To avoid overcrowding the panel, the PDE result for fW = 15 is not shown, but it would be only systematically higher compared to the fW = 4 PDE model result and coincident with that for PLE with the corresponding fW = 15 value. See also Fig. A.2 for results based on other scaling relations.
Current usage metrics show cumulative count of Article Views (full-text article views including HTML views, PDF and ePub downloads, according to the available data) and Abstracts Views on Vision4Press platform.
Data correspond to usage on the plateform after 2015. The current usage metrics is available 48-96 hours after online publication and is updated daily on week days.
Initial download of the metrics may take a while.