Fig. 4
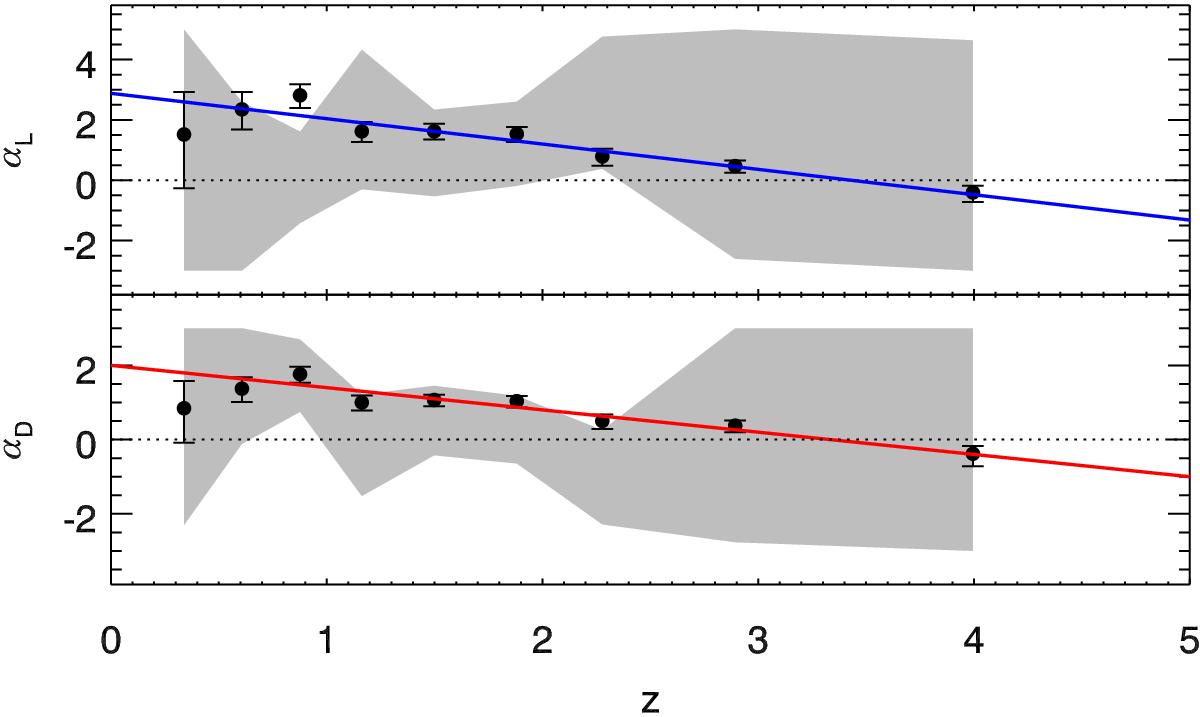
Best-fit parameters for the evolution of the local LF with redshift. The best-fit pure luminosity (density) evolution in a given redshift bin is shown by the black points in the top (bottom) panel. The blue (red) line in the top (bottom) panel shows the simple, continuous 2-parameter pure luminosity (density) evolution model (see text for details). Gray shaded areas in both panels correspond to the 68% confidence interval for a combined luminosity and density evolution. The large uncertainty in the combined fit is due to parameter degeneracy.
Current usage metrics show cumulative count of Article Views (full-text article views including HTML views, PDF and ePub downloads, according to the available data) and Abstracts Views on Vision4Press platform.
Data correspond to usage on the plateform after 2015. The current usage metrics is available 48-96 hours after online publication and is updated daily on week days.
Initial download of the metrics may take a while.