Fig. 3
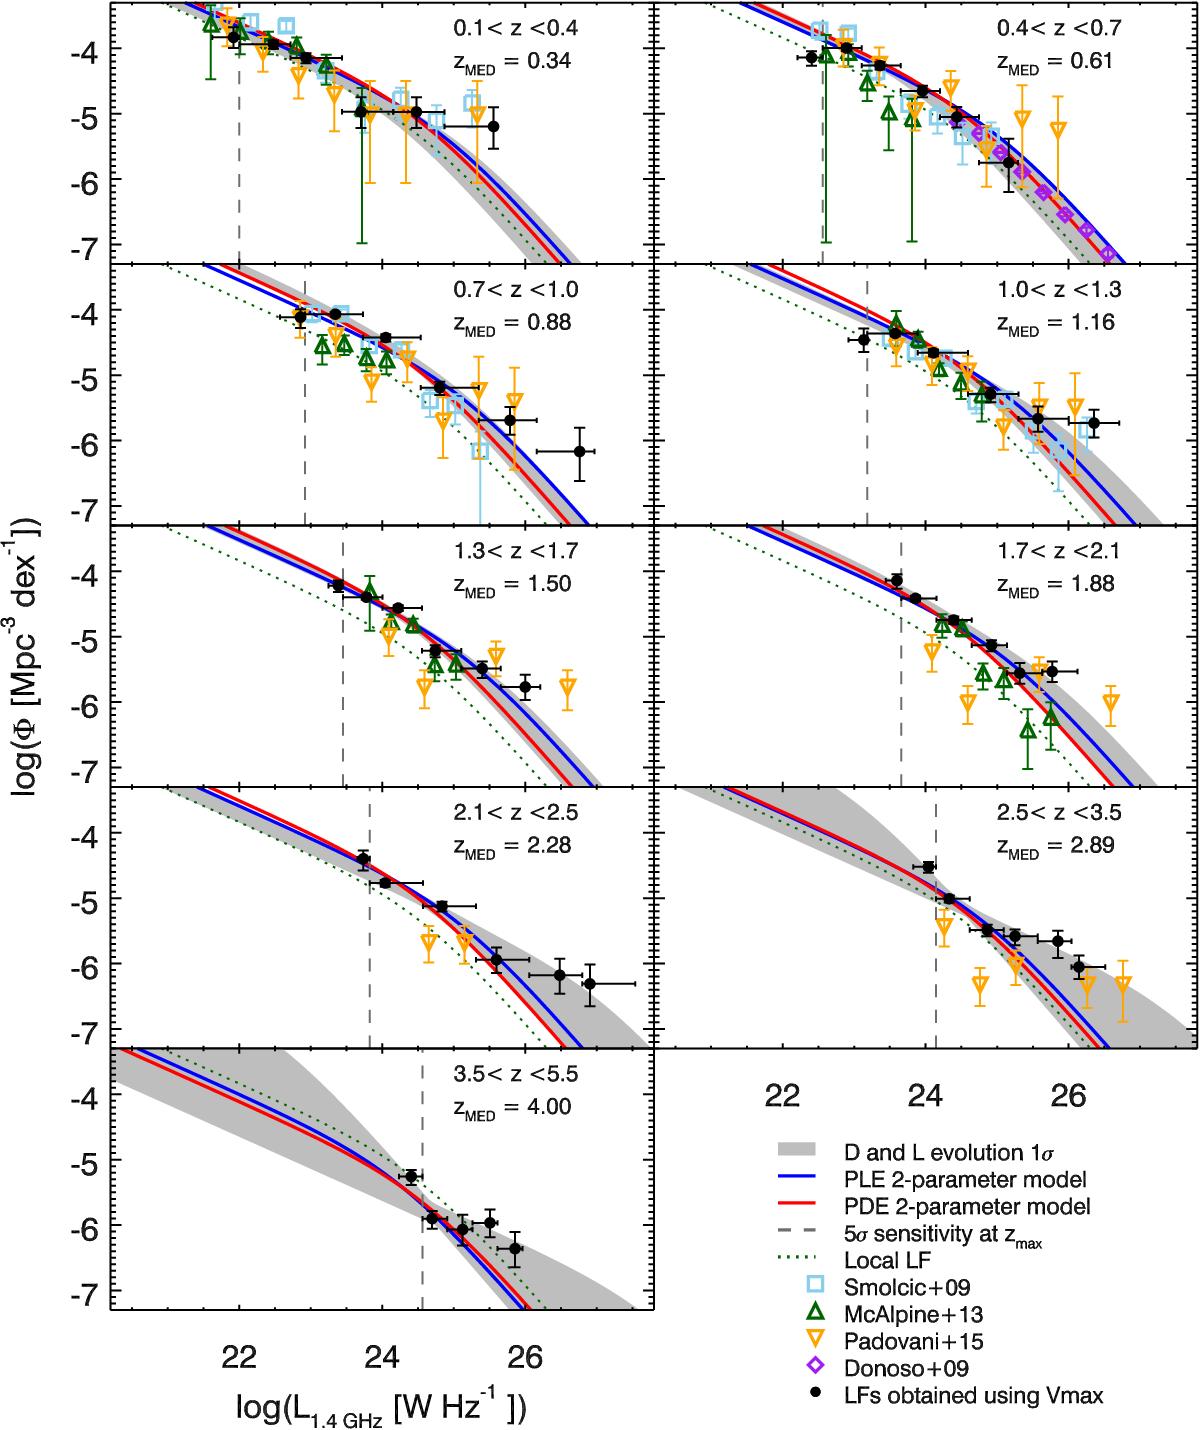
Radio AGN 1.4 GHz rest-frame luminosity functions in nine redshift bins out to z ~ 5 for radio-excess AGN in the COSMOS field. The volume densities derived from our radio sample with the Vmax method are shown by the filled black dots. A 1σ confidence interval of the combined luminosity and density evolution in individual redshift bins is shown as the gray shaded area. Pure luminosity evolution and pure density evolution 2-parameter models are shown with blue and red lines, respectively (see text for details). The dotted curve in each panel indicates the local luminosity function (Eq. (2)). The vertical line in each panel shows the 5σ sensitivity limit (assuming a spectral index of α = − 0.7) at the high-redshift end of each redshift bin. Various results from the literature, as indicated in the legend, are also shown (each scaled to the median redshift in each bin using the evolution model as reported in the corresponding study).
Current usage metrics show cumulative count of Article Views (full-text article views including HTML views, PDF and ePub downloads, according to the available data) and Abstracts Views on Vision4Press platform.
Data correspond to usage on the plateform after 2015. The current usage metrics is available 48-96 hours after online publication and is updated daily on week days.
Initial download of the metrics may take a while.