Fig. 7
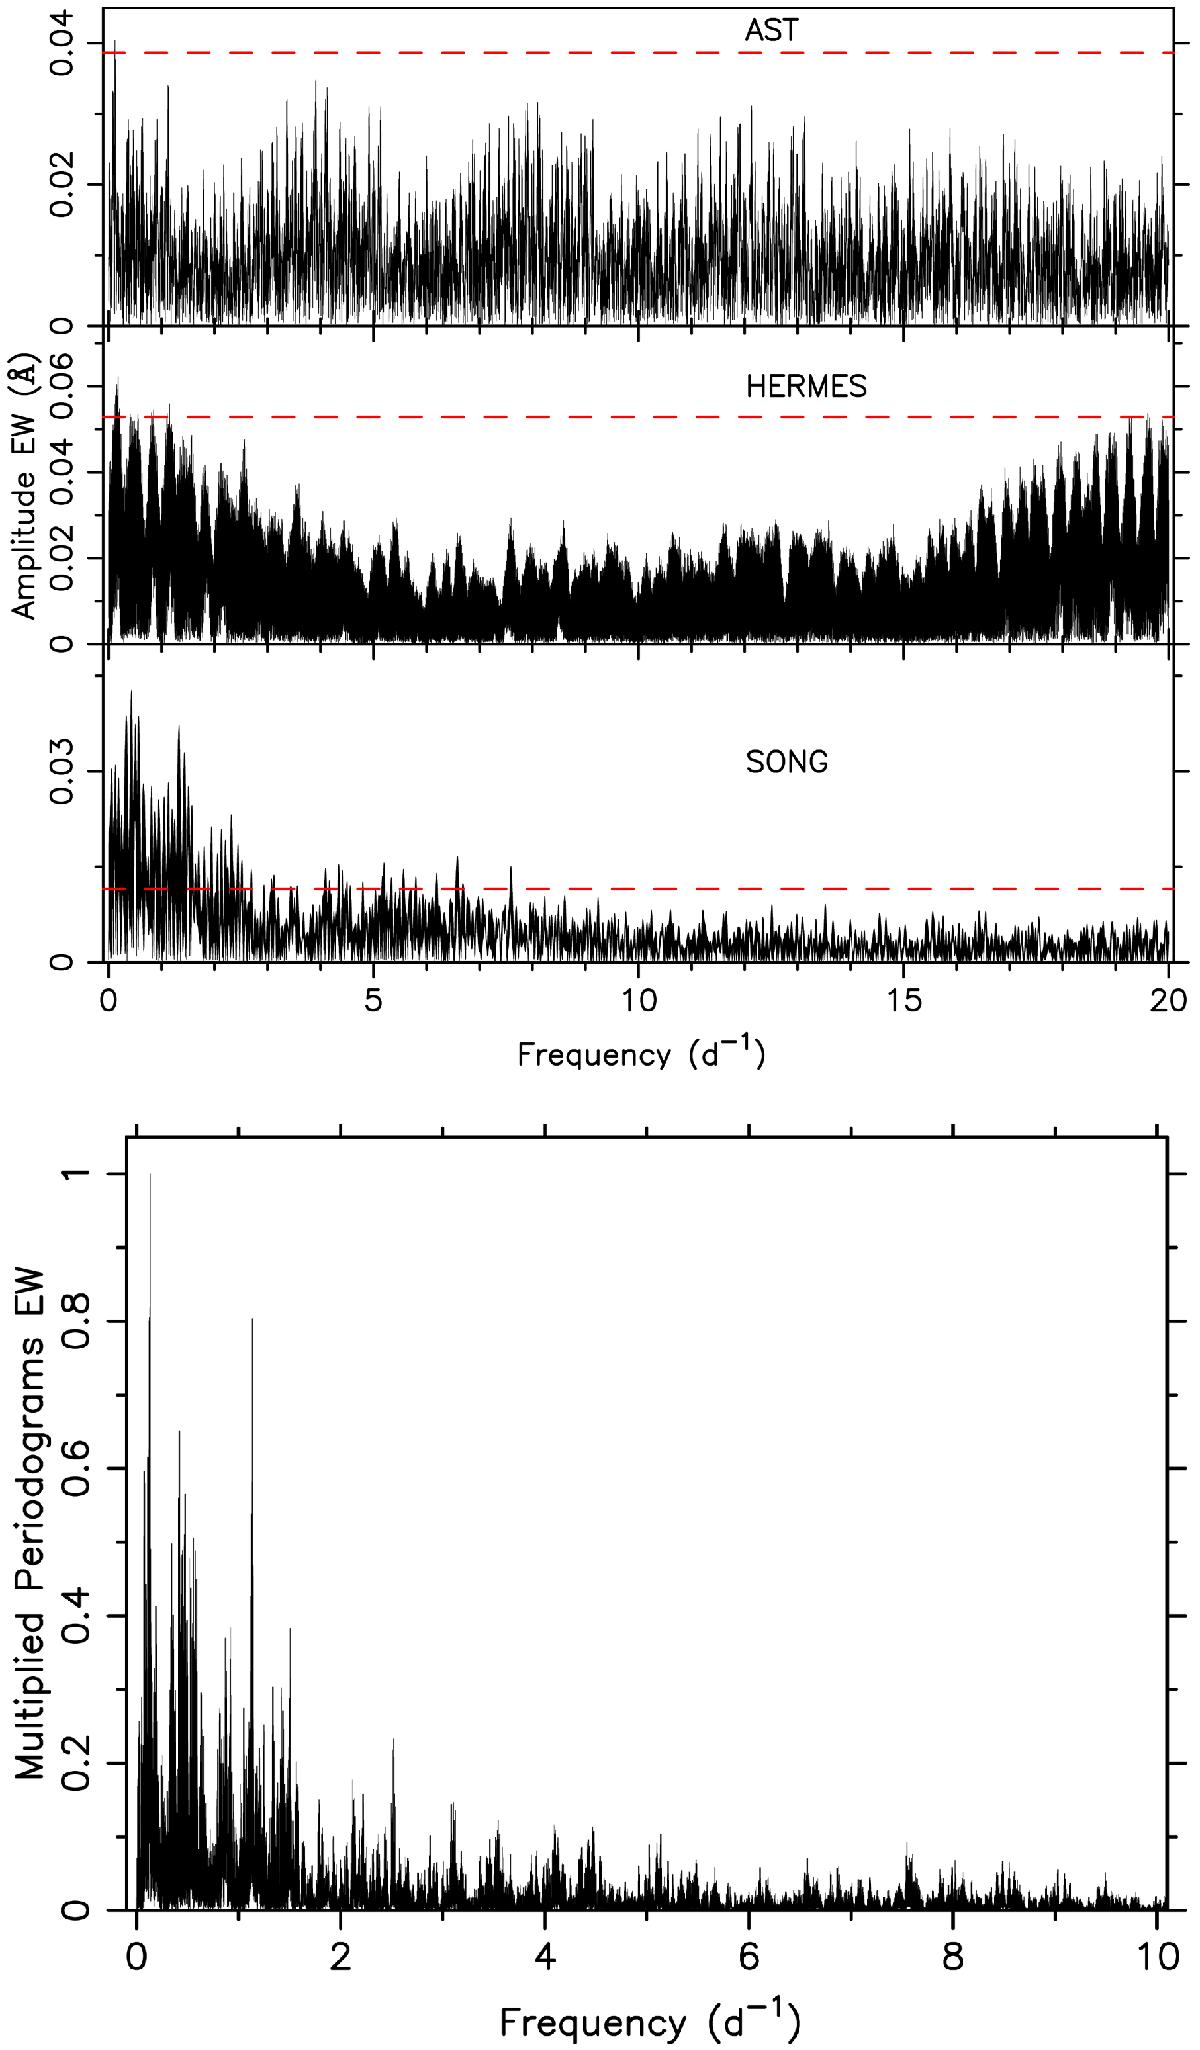
Amplitude spectra for the EW of the He i 5875 Å line for the three individual spectrographs with sufficient data. In the upper panels, the red dashed lines indicate four times the average noise level computed over the range [0,10] d-1. The lower panel shows the result of multiplying the periodograms in the upper panels after weighing them according to the S/N of the dominant frequency and placing the dominant frequency after this multiplication at value 1.
Current usage metrics show cumulative count of Article Views (full-text article views including HTML views, PDF and ePub downloads, according to the available data) and Abstracts Views on Vision4Press platform.
Data correspond to usage on the plateform after 2015. The current usage metrics is available 48-96 hours after online publication and is updated daily on week days.
Initial download of the metrics may take a while.