Free Access
Fig. 5
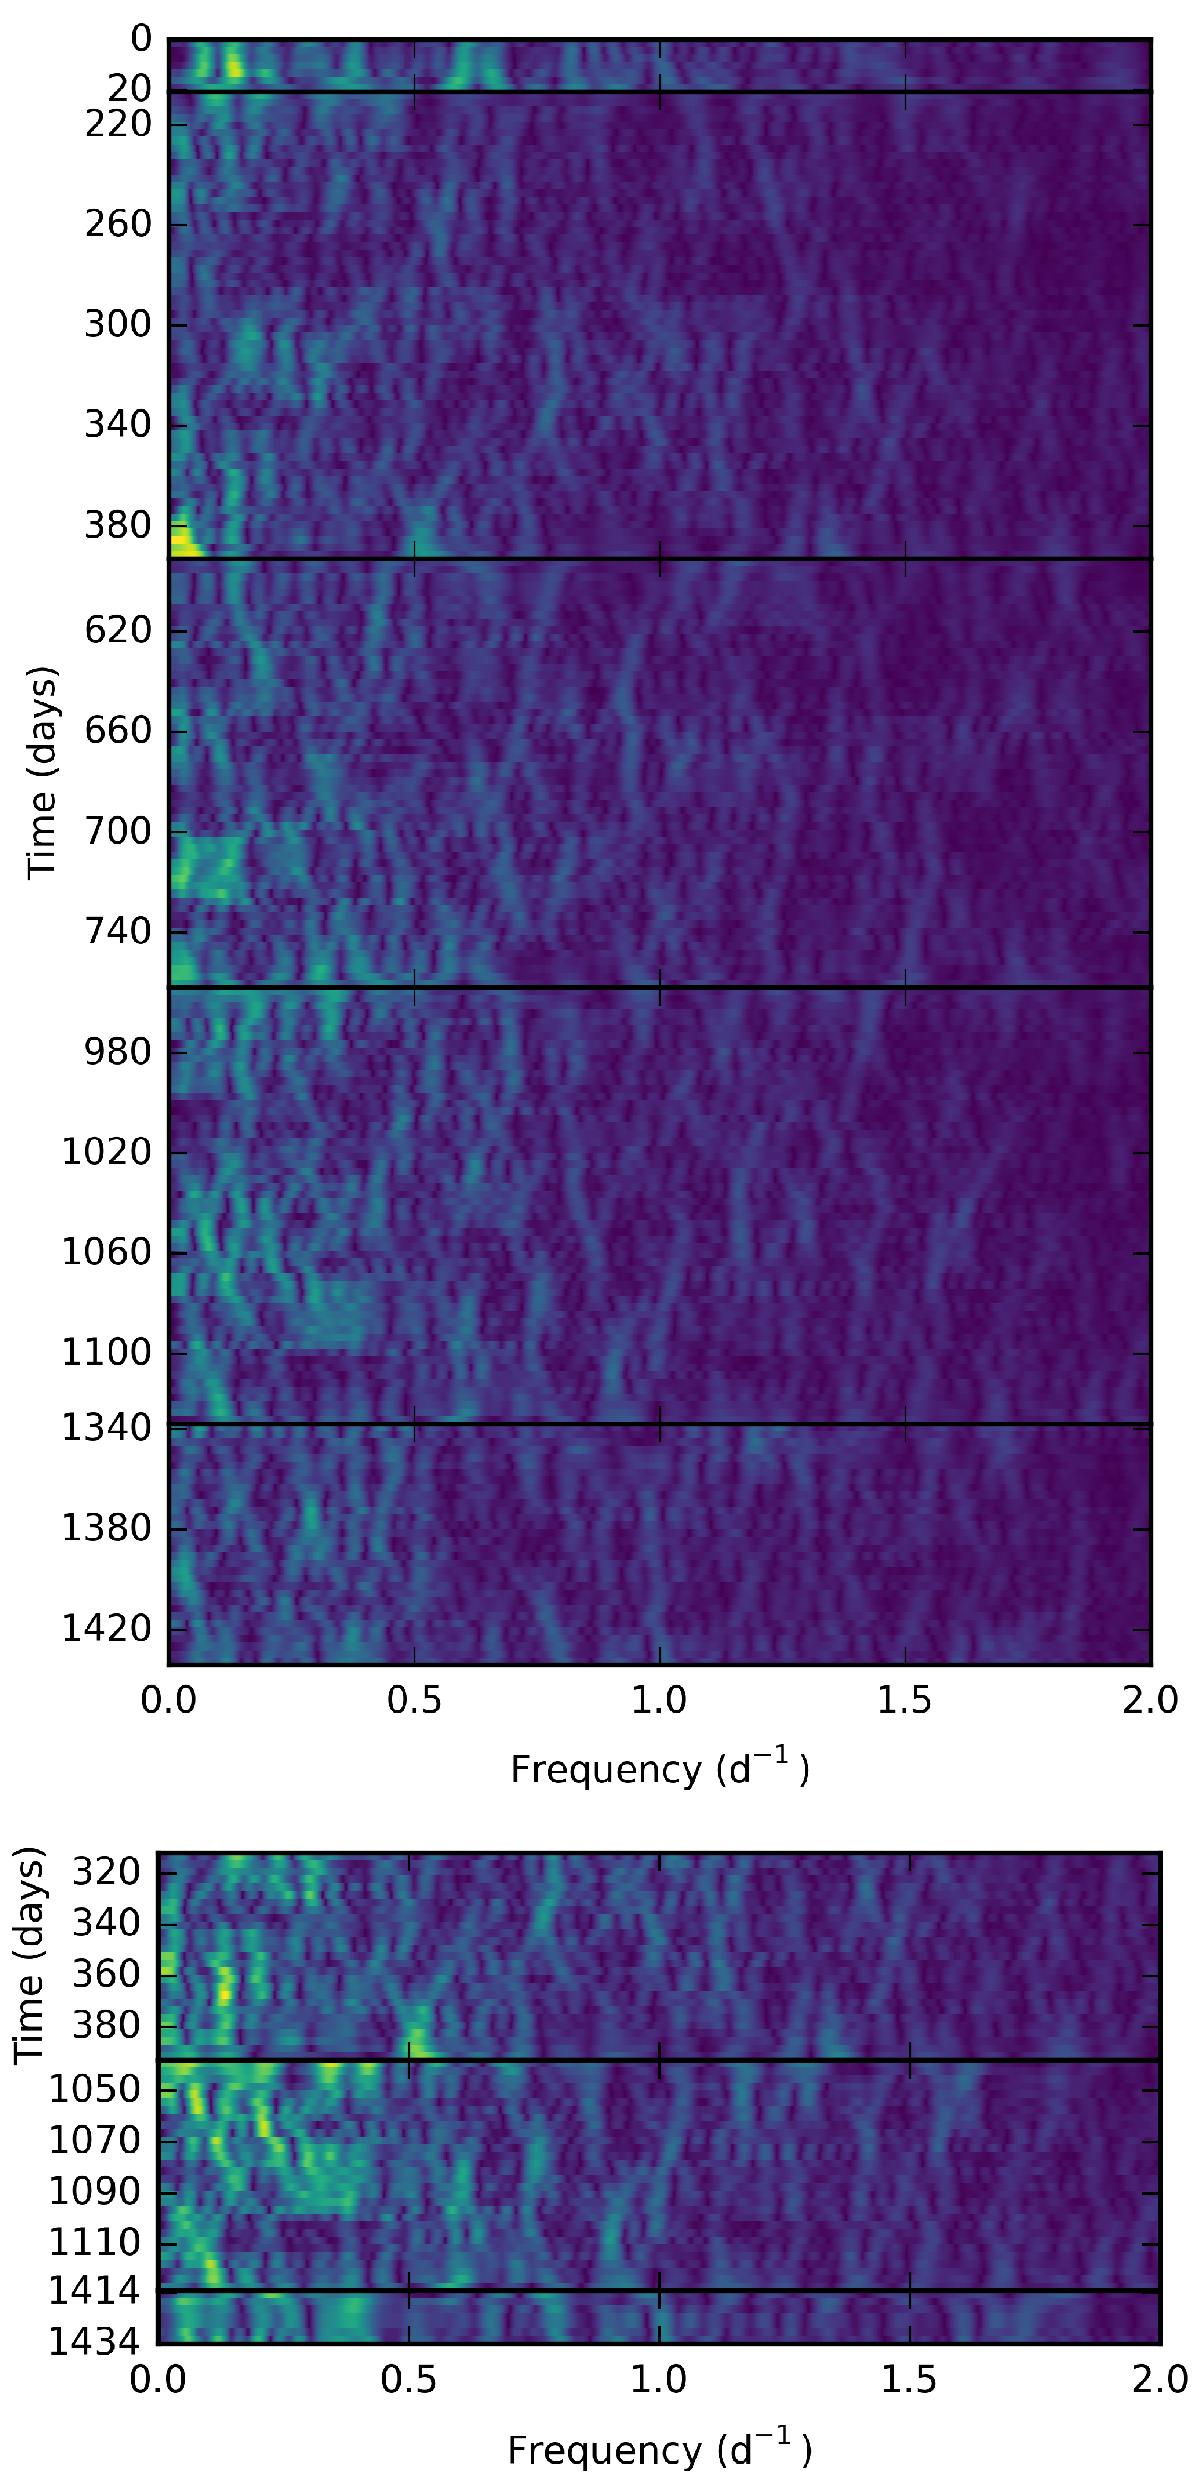
Short-time Fourier transforms of the Kepler light curves in mask 45 (upper) and 32 (lower) for all observed quarters for a 30-day time window and progressing in the time series with a step of 3 days, zoomed into the region of low-frequency amplitude excess. Brighter colours represent higher amplitudes.
This figure is made of several images, please see below:
Current usage metrics show cumulative count of Article Views (full-text article views including HTML views, PDF and ePub downloads, according to the available data) and Abstracts Views on Vision4Press platform.
Data correspond to usage on the plateform after 2015. The current usage metrics is available 48-96 hours after online publication and is updated daily on week days.
Initial download of the metrics may take a while.