Fig. 2
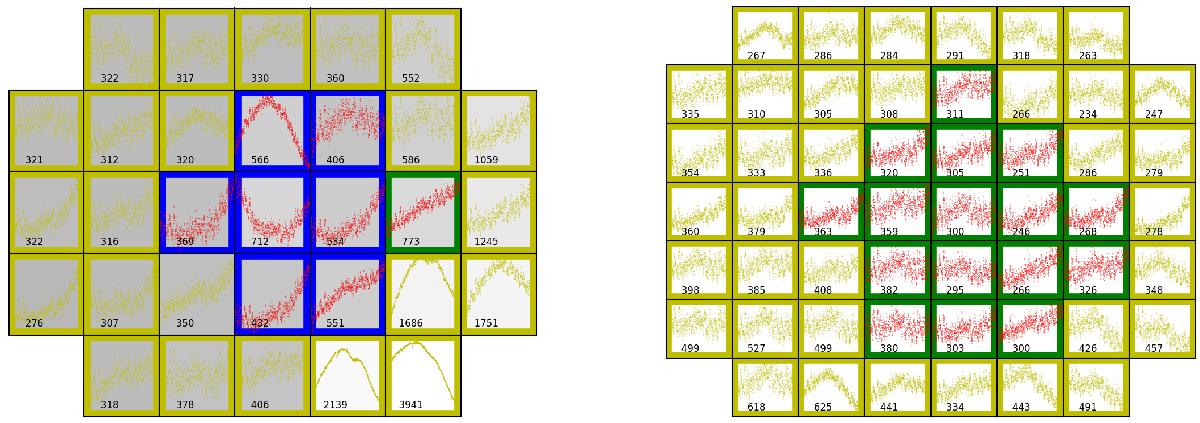
Example of pixel masks used to create three versions of the light curves for star 45 (left) and 32 (right). The detected light curve is plotted within each pixel and represents an addition of 270 individual exposures of 6.54 s, added on board of the satellite. In long-cadence mode, such pixel data are downloaded from the spacecraft in time stamps of 29.42 min. The values listed in every pixel indicate the S/N level of the flux in the pixel. The red dots in the pixels with green and blue borders were used to extract the standard Kepler light curves. We also computed light curves based on the data in the yellow pixels alone and from adding the green, blue, and yellow pixels.
Current usage metrics show cumulative count of Article Views (full-text article views including HTML views, PDF and ePub downloads, according to the available data) and Abstracts Views on Vision4Press platform.
Data correspond to usage on the plateform after 2015. The current usage metrics is available 48-96 hours after online publication and is updated daily on week days.
Initial download of the metrics may take a while.