Fig. 15
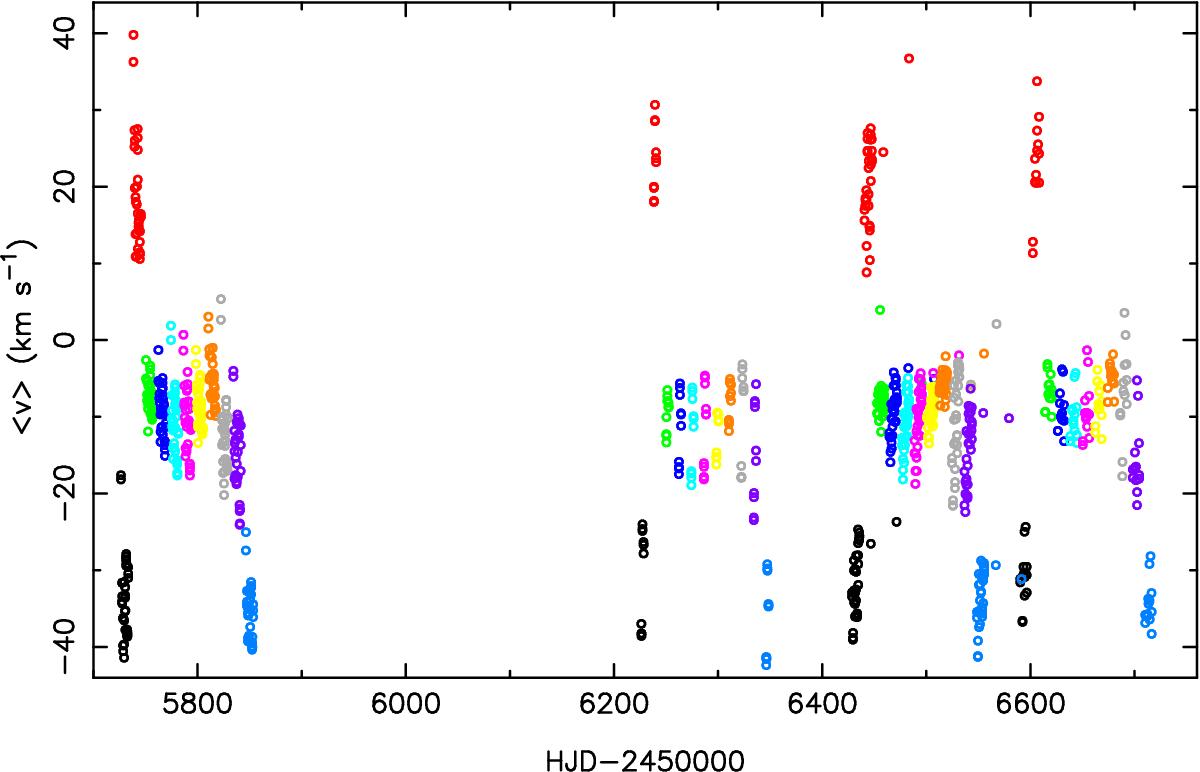
HERMES spectroscopy of HD 188209 covering some 870 days of monitoring during four epochs. The centroid velocity is shown for all available spectral lines except Hα. The colour coding is the same as in Fig. 12. For visibility purposes, the values for each spectral line were shifted in time with multiples of 12 d, Hβ in black representing the true HJD.
Current usage metrics show cumulative count of Article Views (full-text article views including HTML views, PDF and ePub downloads, according to the available data) and Abstracts Views on Vision4Press platform.
Data correspond to usage on the plateform after 2015. The current usage metrics is available 48-96 hours after online publication and is updated daily on week days.
Initial download of the metrics may take a while.