Free Access
Fig. 14
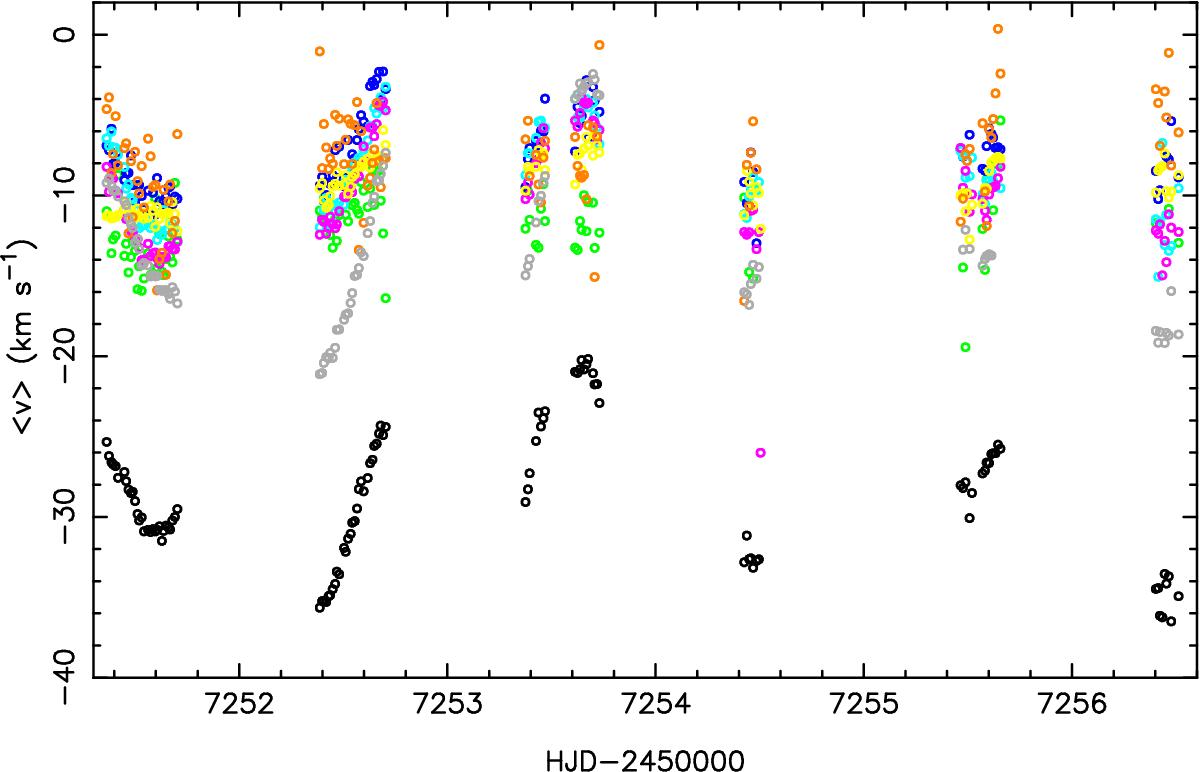
Excerpt of the SONG spectroscopy during 5 consecutive days. The centroid velocity is shown for 9 available spectral lines; the He ii 4686 Å line was avoided for visibility purposes. The colour coding is the same as in Fig. 12.
Current usage metrics show cumulative count of Article Views (full-text article views including HTML views, PDF and ePub downloads, according to the available data) and Abstracts Views on Vision4Press platform.
Data correspond to usage on the plateform after 2015. The current usage metrics is available 48-96 hours after online publication and is updated daily on week days.
Initial download of the metrics may take a while.