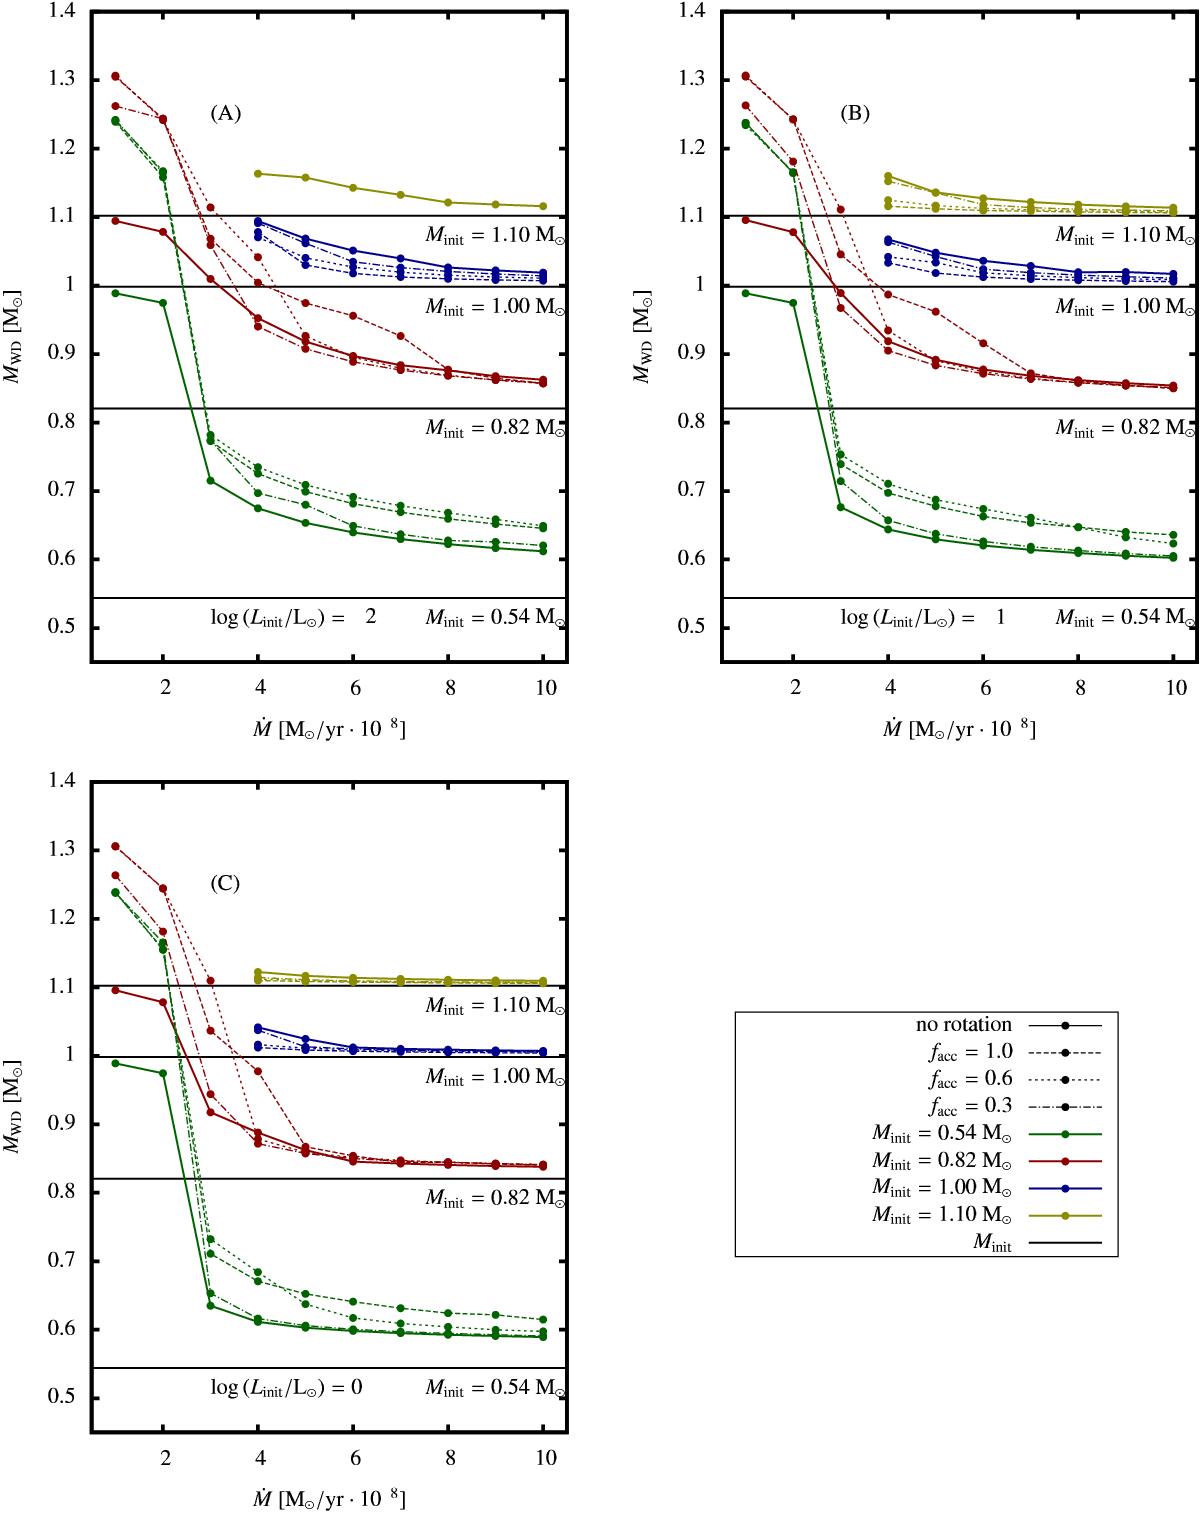
Fig. 7

Total masses (M) of all computed model sequences of this study with respect to constant mass accretion rate (Ṁ). The presented graphs differ in the chosen initial luminosity of the white dwarf model with log (Linit/L⊙) = −2 in graph A), log (Linit/L⊙) = −1 in B) and log (Linit/L⊙) = 0 in C). Black solid lines correspond to the initial mass of each model sequence with the initial mass being indicated. Colored lines indicate the final mass of each model sequence with green corresponding to Minit = 0.54 M⊙, red to Minit = 0.82 M⊙, blue to Minit = 1.00 M⊙ and yellow to Minit = 1.10 M⊙. Line types indicate chosen rotational parameters. Solid colored lines for non-rotating models, dashed lines for facc = 1.0, dotted lines for facc = 0.6 and dash-dotted lines for facc = 0.3. Dots indicate the masses of individual models.
Current usage metrics show cumulative count of Article Views (full-text article views including HTML views, PDF and ePub downloads, according to the available data) and Abstracts Views on Vision4Press platform.
Data correspond to usage on the plateform after 2015. The current usage metrics is available 48-96 hours after online publication and is updated daily on week days.
Initial download of the metrics may take a while.


