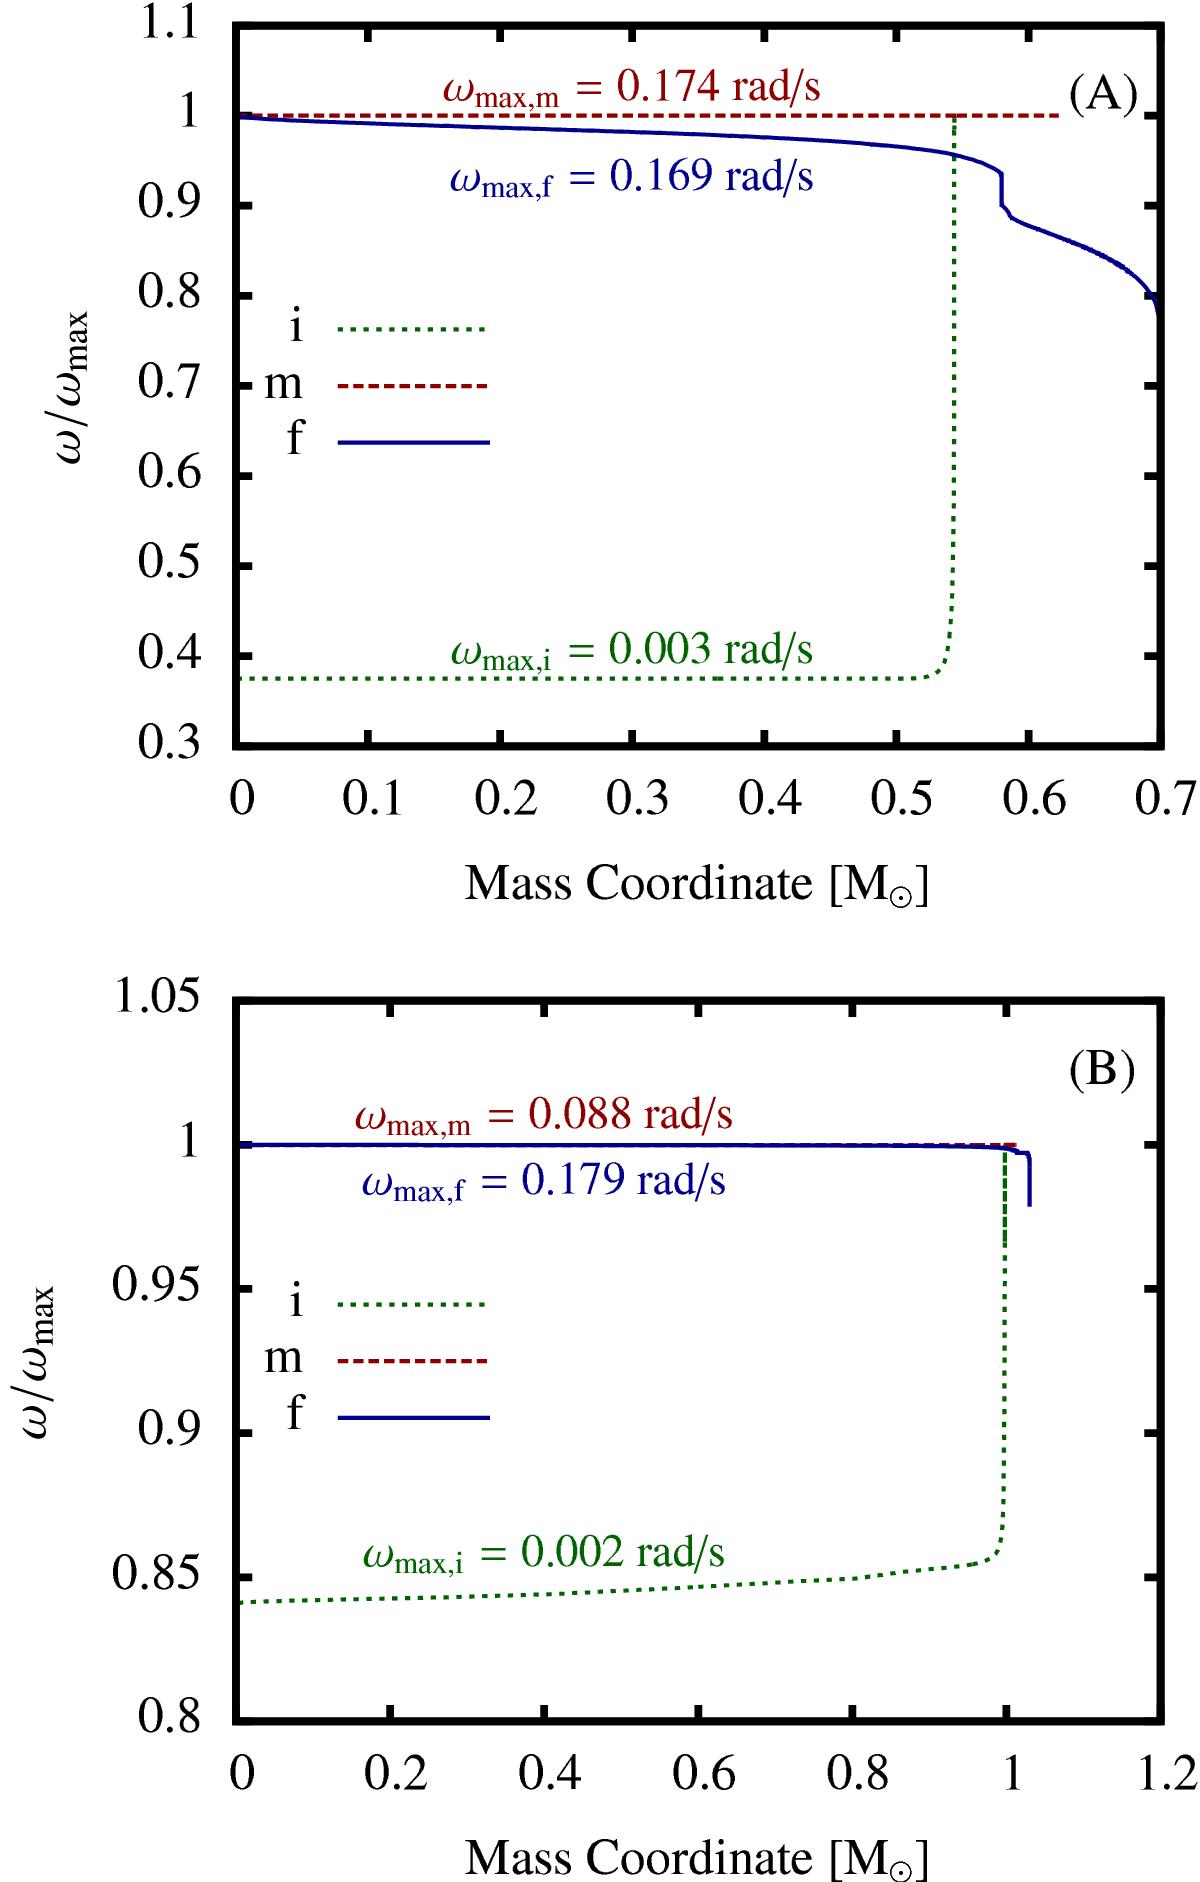
Fig. 1

Rotational velocity profile of model sequence Lm20510-5 (Minit = 0.54 M⊙) (A) and Lm21010-5 (Minit = 1.0 M⊙) (B) at three different times during its evolution (facc = 1.0, Ṁ = 5 × 10⁻⁸M⊙/ yr and log (Linit/L⊙) = −2 in both cases). Line i corresponds to t = 0 yr, the start of mass accretion, m to the midpoint of the accretion phase and f to just after the point of He-ignition. In subfigure A) this corresponds to m at t ~ 1.55 Myr and f at t = 3.11 Myr. In subfigure B) the corresponding times are m at t ~ 0.3 Myr and f at t = 0.64 Myr. The y-axis is normalized to unity with the maximum value of each graph indicated in ωmax.
Current usage metrics show cumulative count of Article Views (full-text article views including HTML views, PDF and ePub downloads, according to the available data) and Abstracts Views on Vision4Press platform.
Data correspond to usage on the plateform after 2015. The current usage metrics is available 48-96 hours after online publication and is updated daily on week days.
Initial download of the metrics may take a while.


