Fig. 9
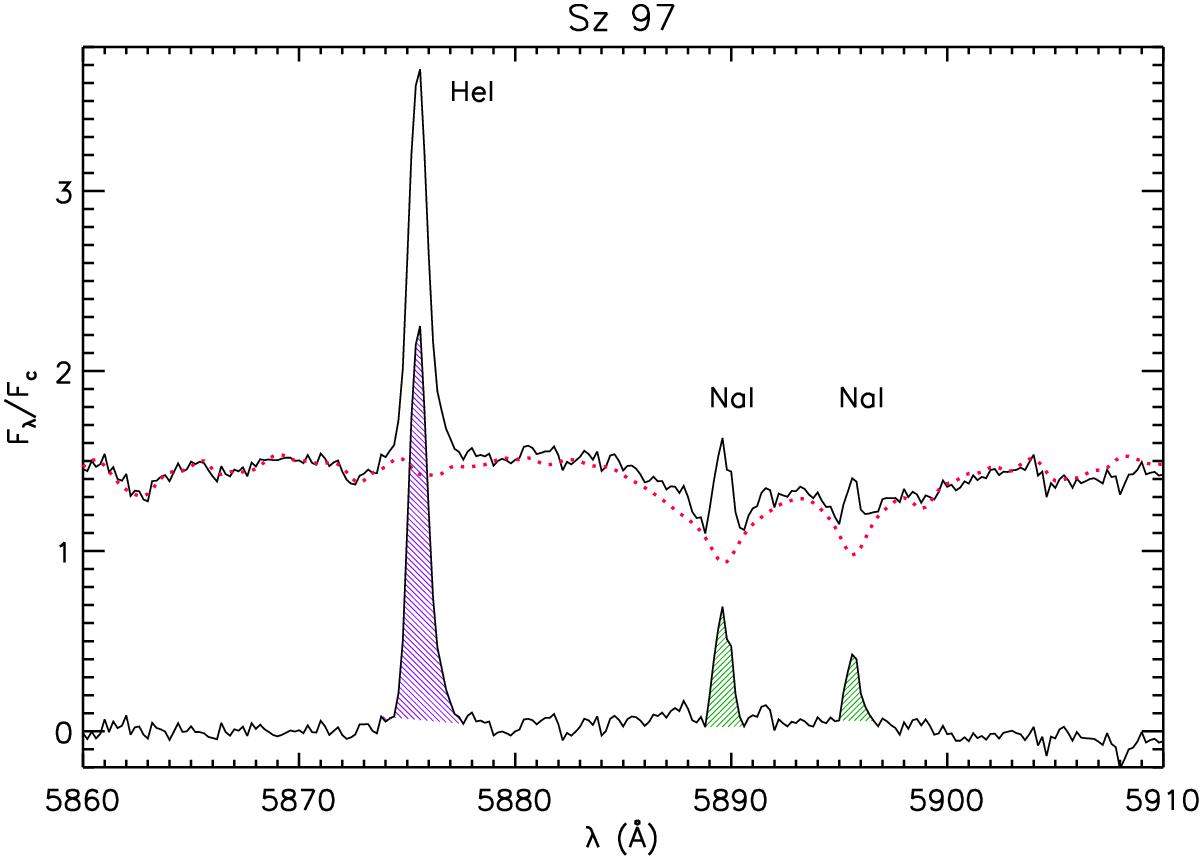
Example of the spectral subtraction for the Na i D1,2 and He i D3 lines of Sz 97. Solid and dotted red lines have the same meaning as in Fig. 7. An offset of 0.5 was applied to both the observed and synthetic spectra for visualization purposes. The hatched green areas in the “difference” spectrum represent the Na i D1,2 excess emissions, while the He i D3 residual emission is filled with violet hatching.
Current usage metrics show cumulative count of Article Views (full-text article views including HTML views, PDF and ePub downloads, according to the available data) and Abstracts Views on Vision4Press platform.
Data correspond to usage on the plateform after 2015. The current usage metrics is available 48-96 hours after online publication and is updated daily on week days.
Initial download of the metrics may take a while.