Fig. 8
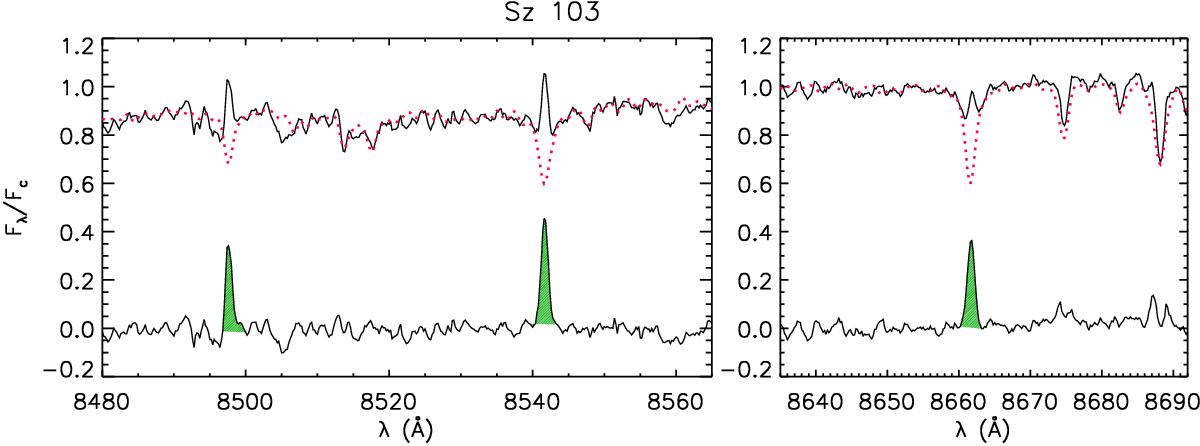
Example of the spectral subtraction for the Ca ii IRT lines of Sz 103. Observed spectrum and inactive template are traced with a solid black line and dotted red line, respectively. The difference between observed and template spectrum is shown in the bottom of each panel, along with the residual emission in the Ca ii IRT line cores (hatched green areas).
Current usage metrics show cumulative count of Article Views (full-text article views including HTML views, PDF and ePub downloads, according to the available data) and Abstracts Views on Vision4Press platform.
Data correspond to usage on the plateform after 2015. The current usage metrics is available 48-96 hours after online publication and is updated daily on week days.
Initial download of the metrics may take a while.