Fig. 7
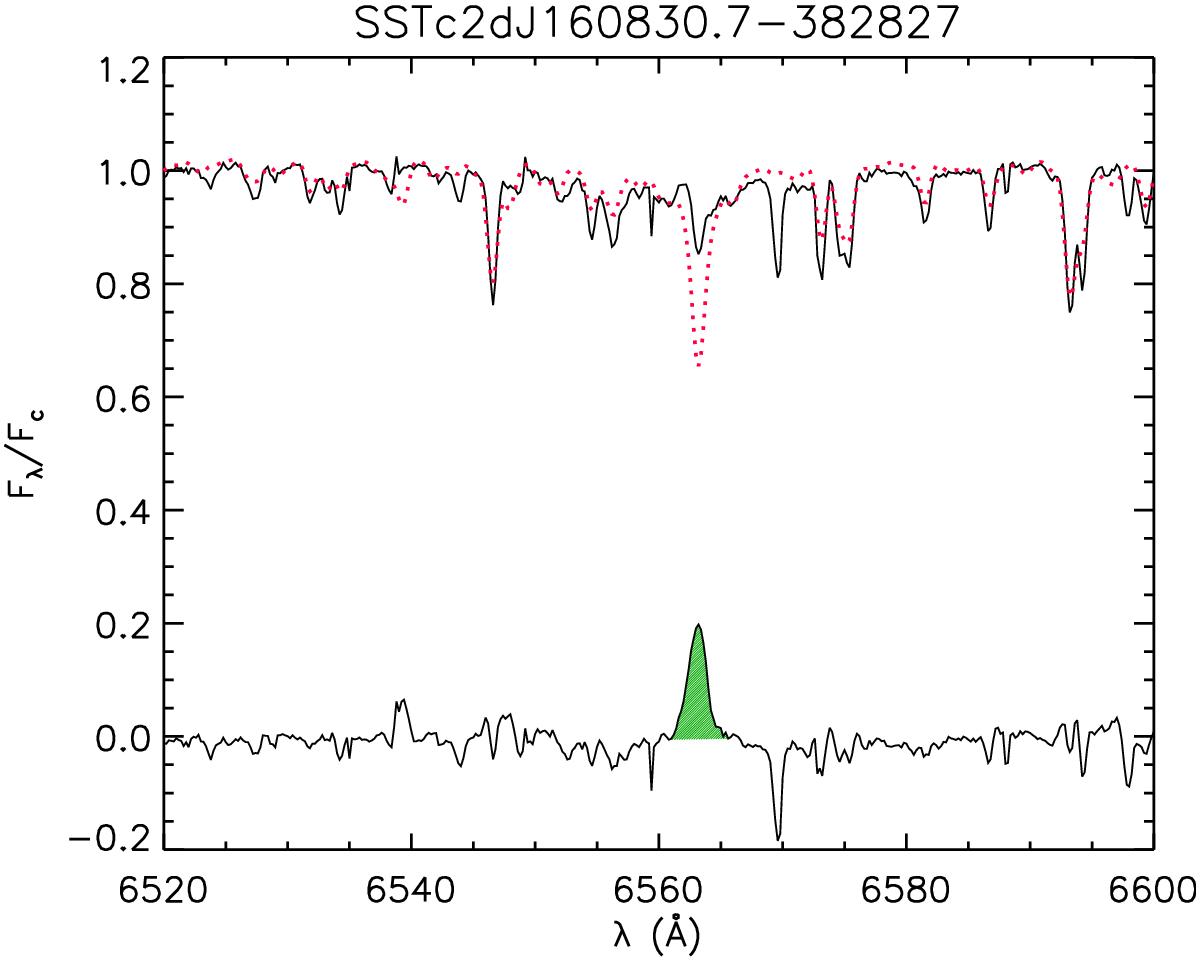
Example of the spectral subtraction for the Hα line of SSTc2dJ160830.7-382827. The target spectrum normalized to the local continuum is represented by a solid black line, while the best-fitting BT-Settl spectrum is overplotted with a dotted red line. The difference spectrum is shown in the bottom of the panel, where the residual Hα emission is highlighted by the hatched green area.
Current usage metrics show cumulative count of Article Views (full-text article views including HTML views, PDF and ePub downloads, according to the available data) and Abstracts Views on Vision4Press platform.
Data correspond to usage on the plateform after 2015. The current usage metrics is available 48-96 hours after online publication and is updated daily on week days.
Initial download of the metrics may take a while.