Fig. 6
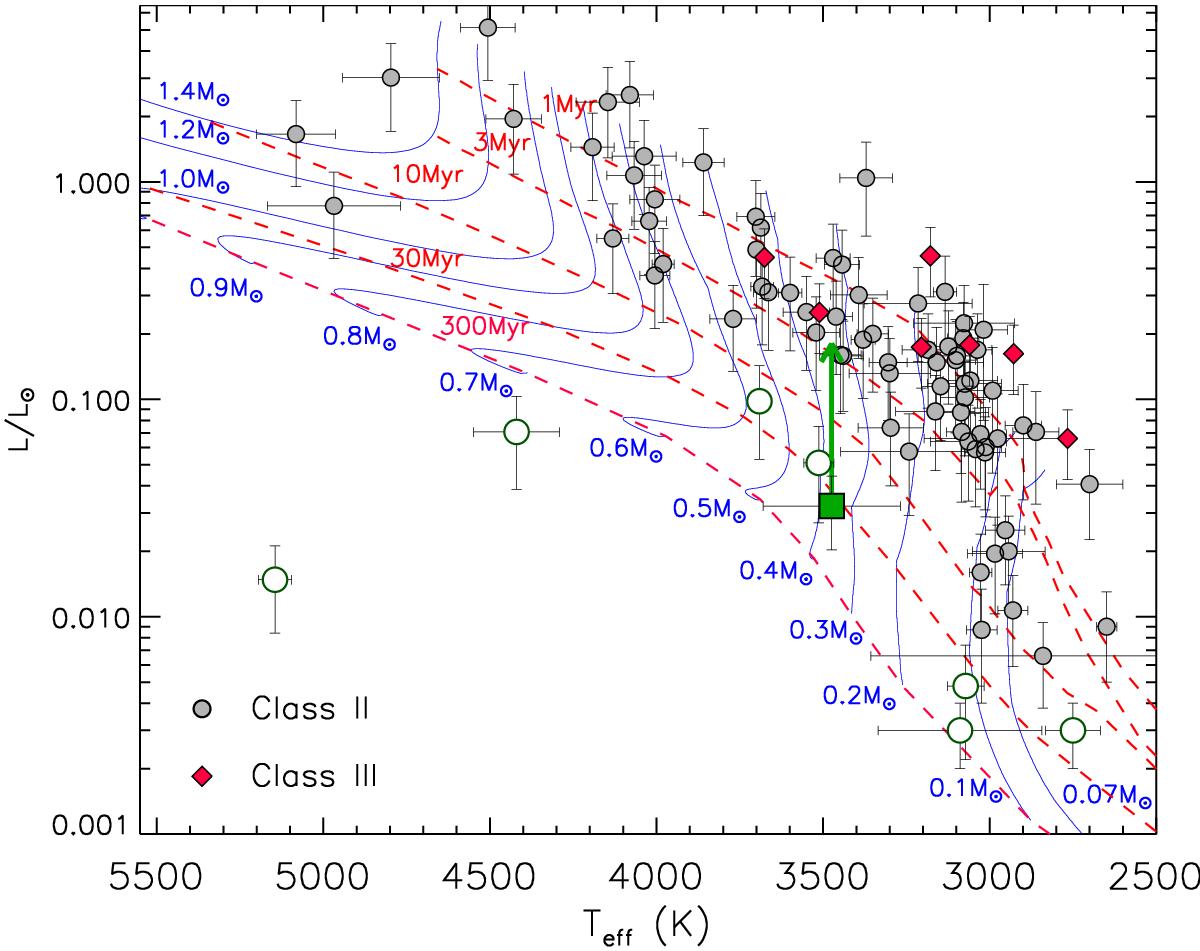
Hertzsprung-Russell diagram of the Lupus members. The evolutionary tracks of Baraffe et al. (2015) are shown as solid lines with the labels representing their masses. The isochrones at 1, 3, 10, 30, and 300 Myr by the same authors are shown with dashed lines. Big open circles denote subluminous objects. The green arrowhead indicates the position of the flat source SSTc2dJ160708.6-391408 (green filled square) when assuming the bolometric luminosity of 0.18 L⊙ (Evans et al. 2009).
Current usage metrics show cumulative count of Article Views (full-text article views including HTML views, PDF and ePub downloads, according to the available data) and Abstracts Views on Vision4Press platform.
Data correspond to usage on the plateform after 2015. The current usage metrics is available 48-96 hours after online publication and is updated daily on week days.
Initial download of the metrics may take a while.