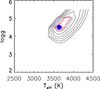
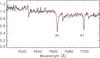
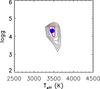
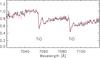
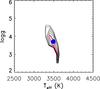
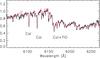
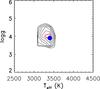
Fig. B.2
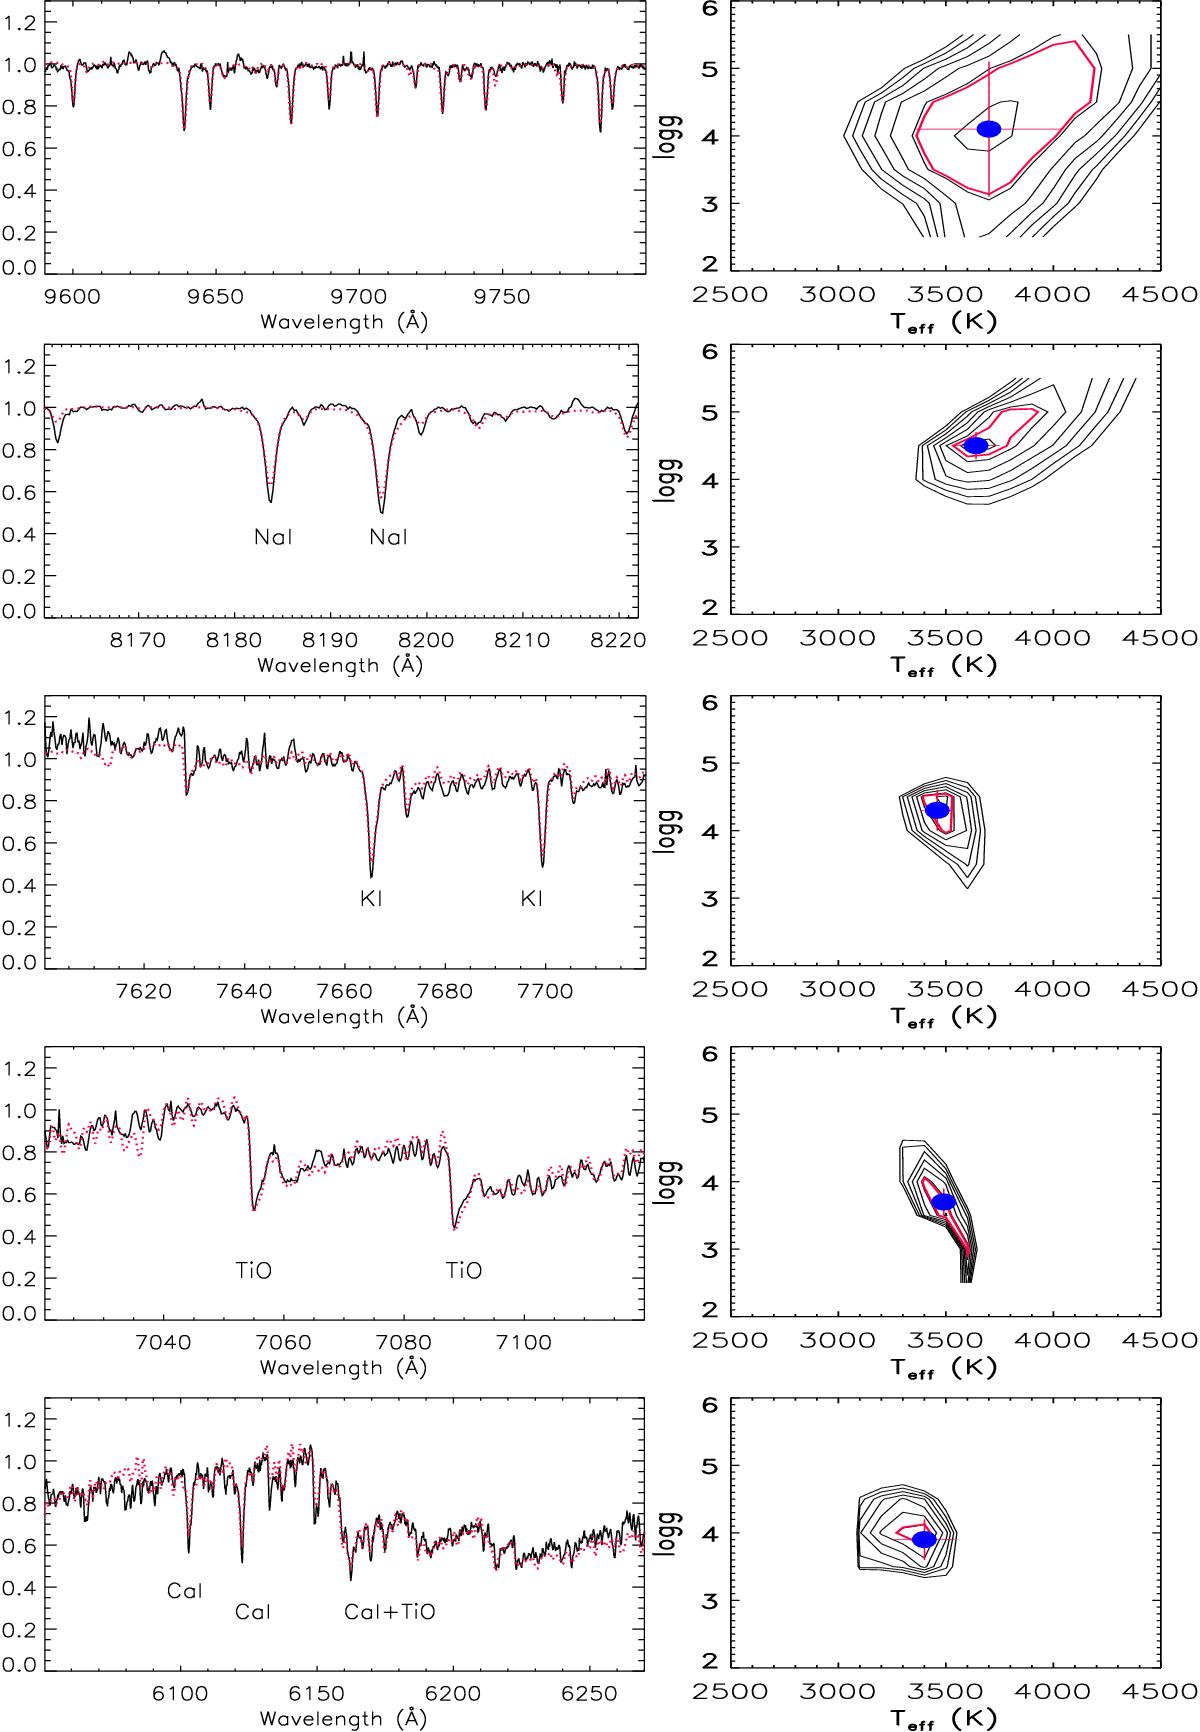
Left panels: continuum-normalized VIS X-shooter spectrum of Sz 117 in the five regions analyzed with ROTFIT (black full lines) with the best fitting template overplotted (red dotted lines). Right panels: χ2 contour maps in the Teff–log g plane. In each panel, the blue dot indicates the best values of Teff and log g, while the 1σ confidence level is denoted by the thick red contour. The errorbars on Teff and log g are also indicated.
Current usage metrics show cumulative count of Article Views (full-text article views including HTML views, PDF and ePub downloads, according to the available data) and Abstracts Views on Vision4Press platform.
Data correspond to usage on the plateform after 2015. The current usage metrics is available 48-96 hours after online publication and is updated daily on week days.
Initial download of the metrics may take a while.