Fig. 2
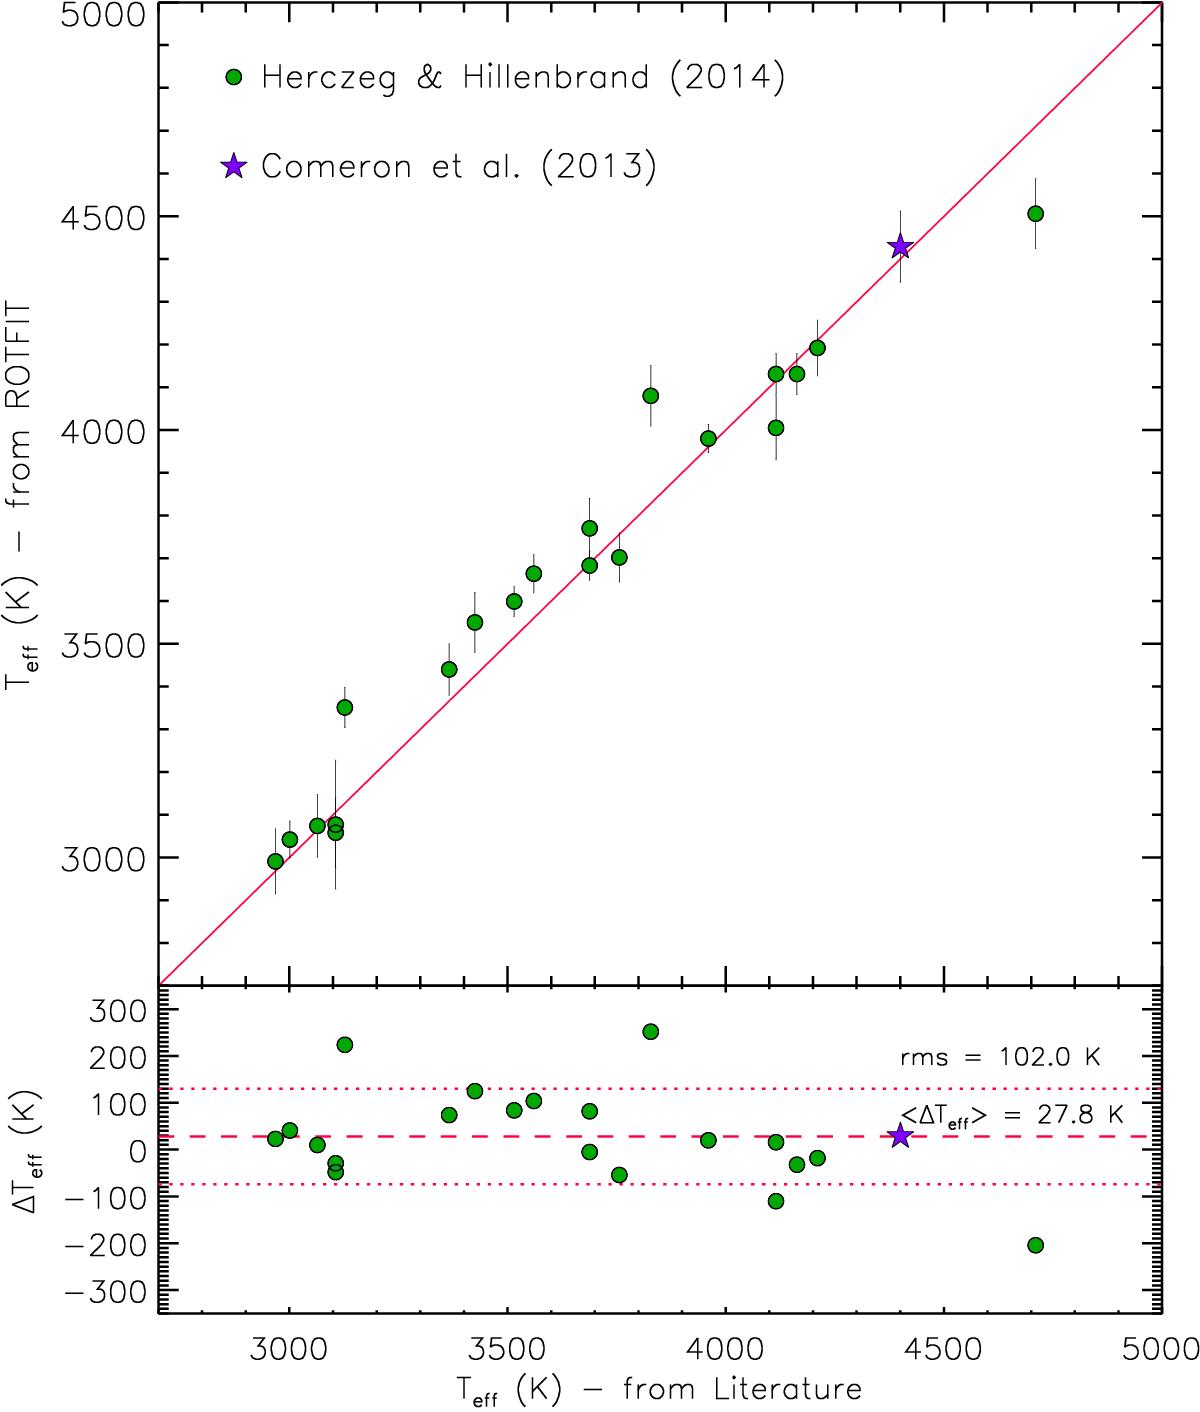
Top panel: comparison between the effective temperature determined with ROTFIT and that derived by Herczeg & Hillenbrand (2014) and Comerón et al. (2013). The solid line represents the 1:1 relationship. The Teff differences (bottom panel) show a mean value of about + 28 K (dashed line) and a standard deviation of about 100 K (dotted lines).
Current usage metrics show cumulative count of Article Views (full-text article views including HTML views, PDF and ePub downloads, according to the available data) and Abstracts Views on Vision4Press platform.
Data correspond to usage on the plateform after 2015. The current usage metrics is available 48-96 hours after online publication and is updated daily on week days.
Initial download of the metrics may take a while.