Fig. B.1
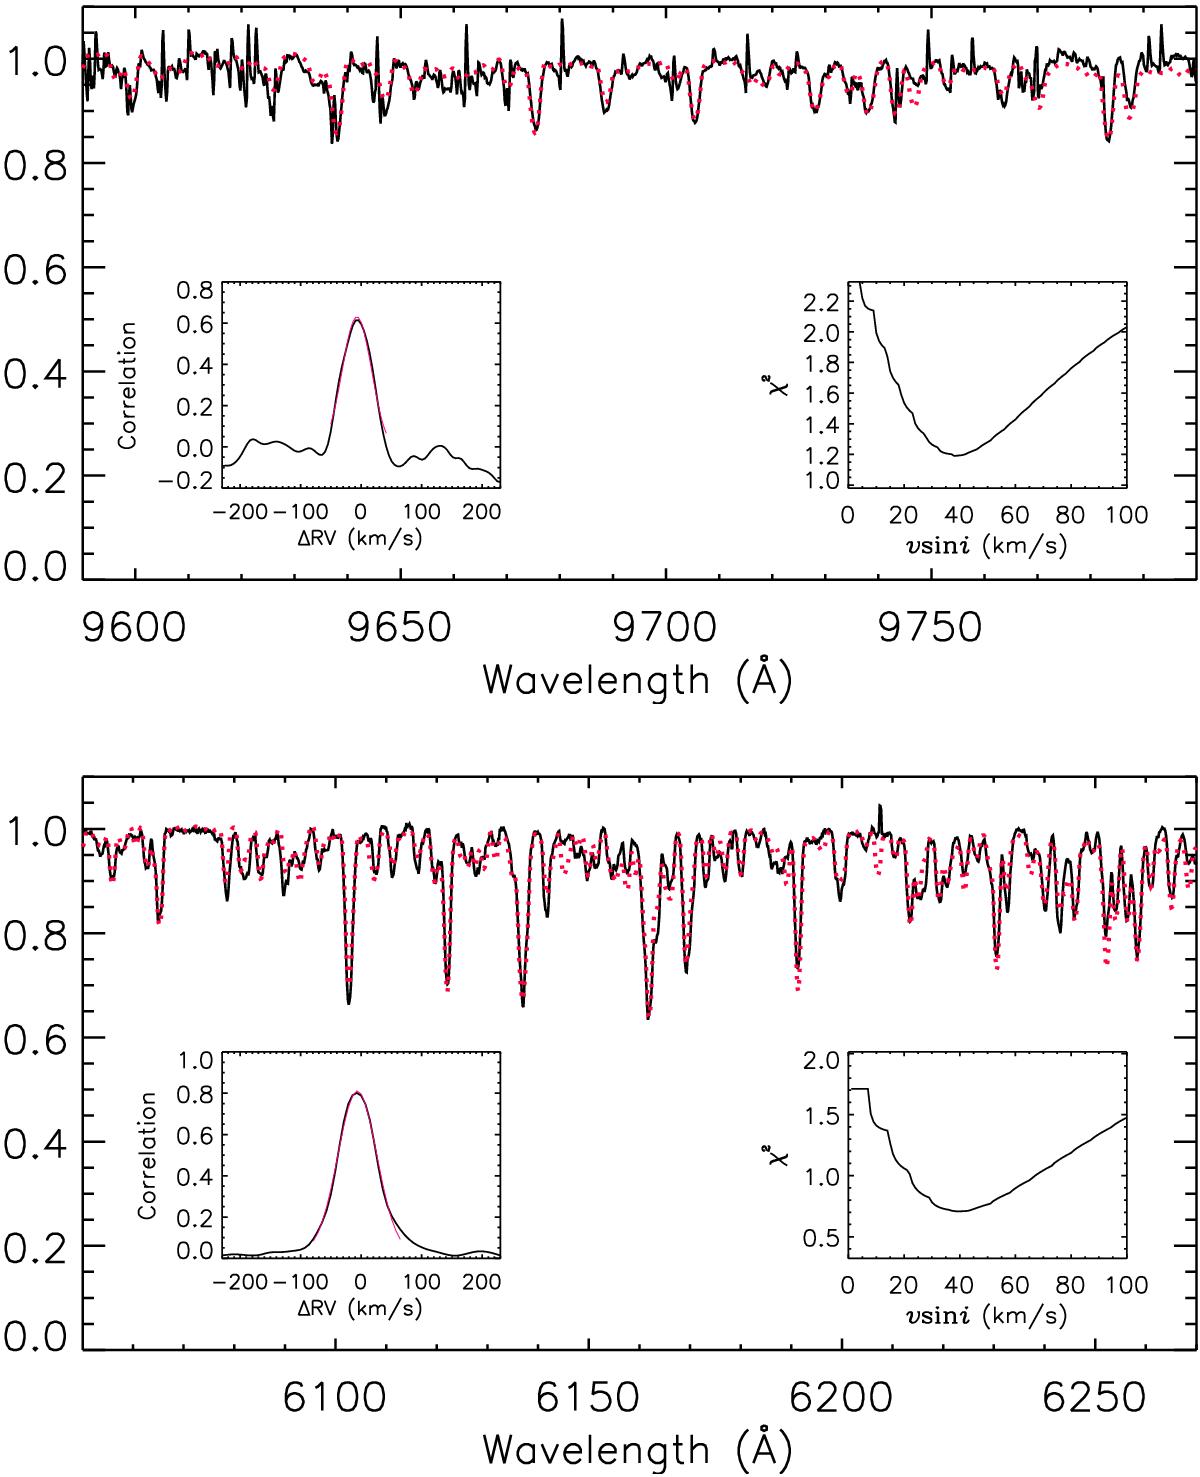
Continuum-normalized VIS X-shooter spectrum of Sz 68 in the two regions selected for the measurement of vsini (black full lines) along with the best fitting template (red dotted lines). The insets in each panel show the cross-correlation function (left boxes) with the Gaussian fit overplotted in red and the χ2 as a function of vsini (right boxes).
Current usage metrics show cumulative count of Article Views (full-text article views including HTML views, PDF and ePub downloads, according to the available data) and Abstracts Views on Vision4Press platform.
Data correspond to usage on the plateform after 2015. The current usage metrics is available 48-96 hours after online publication and is updated daily on week days.
Initial download of the metrics may take a while.