Free Access
Fig. 16
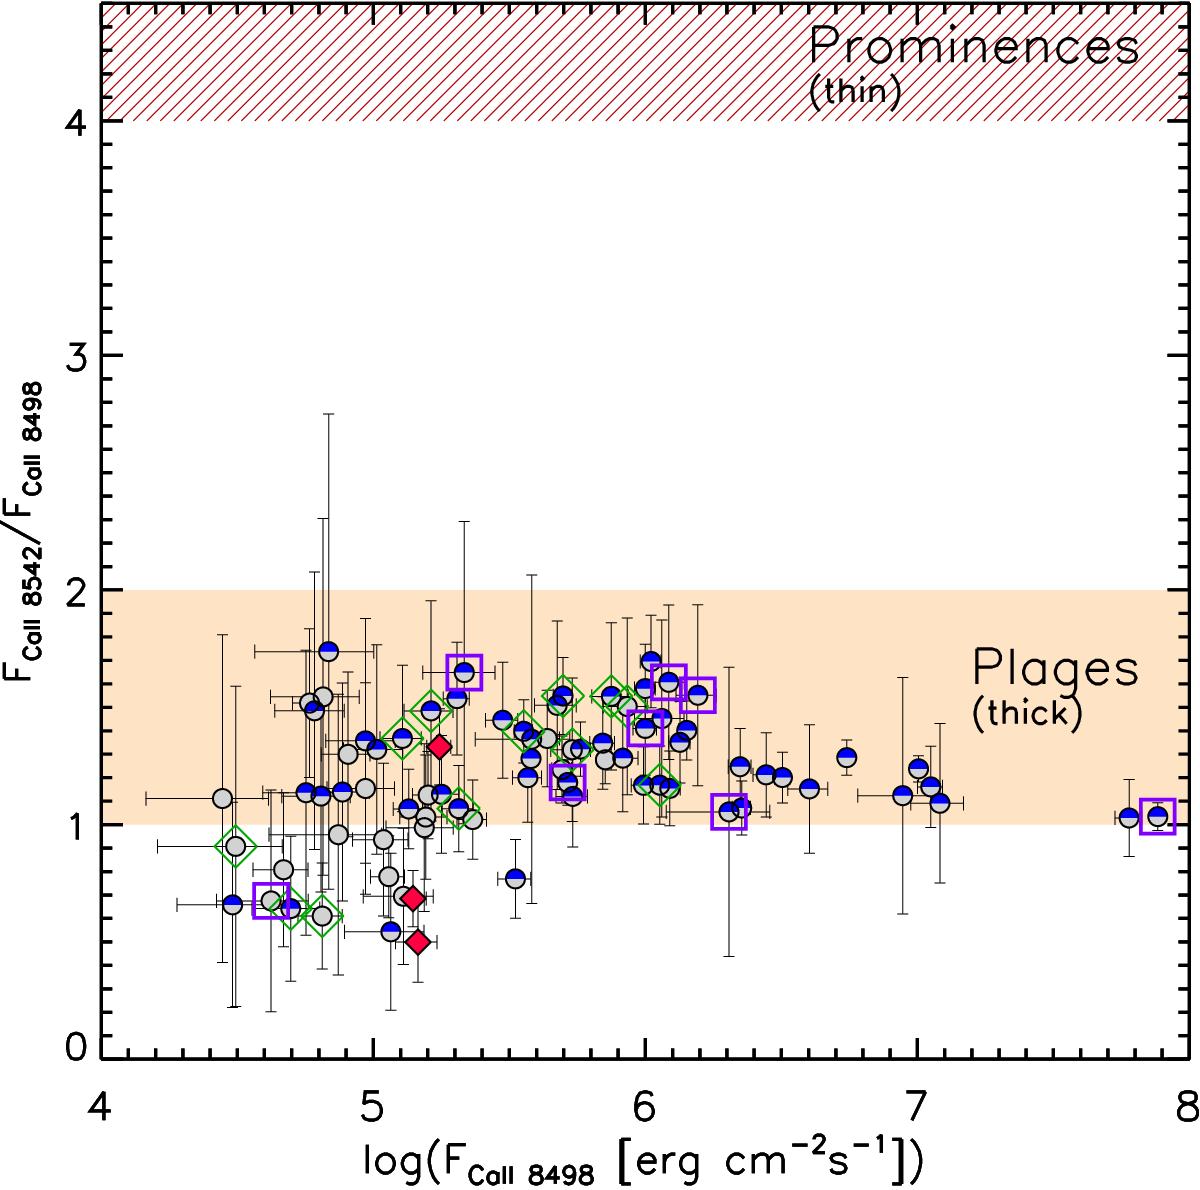
Flux ratio FCaII8542/FCaII8498 vs. FCaII8498. The range of values typical for solar plages and prominences are also shown by the shaded and hatched areas, respectively. Data for subluminous YSOs are enclosed into open violet squares.
Current usage metrics show cumulative count of Article Views (full-text article views including HTML views, PDF and ePub downloads, according to the available data) and Abstracts Views on Vision4Press platform.
Data correspond to usage on the plateform after 2015. The current usage metrics is available 48-96 hours after online publication and is updated daily on week days.
Initial download of the metrics may take a while.