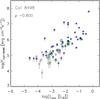
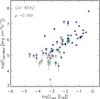
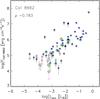
Fig. 15
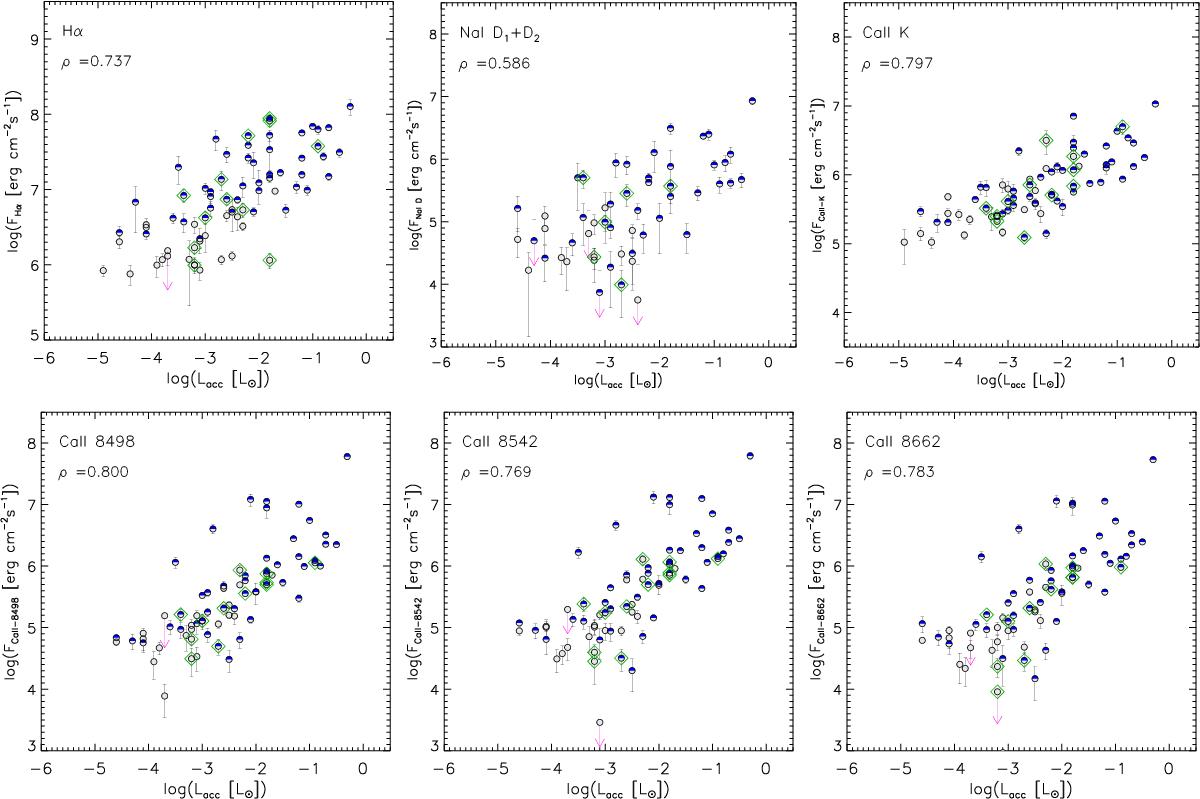
Line fluxes per unit surface as a function of the accretion luminosity. The meaning of the symbols is as in Fig. 10. The value of the rank-correlation coefficient ρ is also reported in each box. The subluminous objects were excluded because Lacc is underestimated (Alcalá et al. 2014, 2017), while the surface fluxes are not affected. Downward arrows indicate upper limits.
Current usage metrics show cumulative count of Article Views (full-text article views including HTML views, PDF and ePub downloads, according to the available data) and Abstracts Views on Vision4Press platform.
Data correspond to usage on the plateform after 2015. The current usage metrics is available 48-96 hours after online publication and is updated daily on week days.
Initial download of the metrics may take a while.