Fig. 11
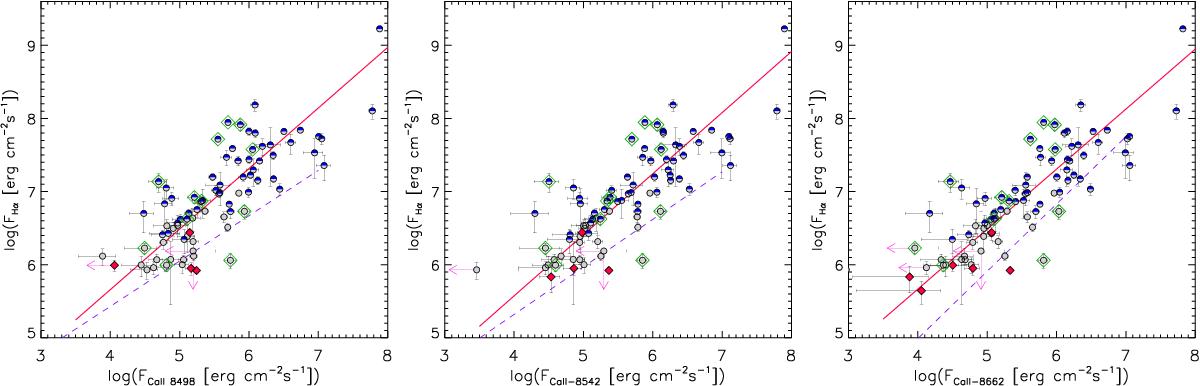
Flux-flux relations between Hα and Ca ii IRT lines (λ 8498, λ 8542, and λ 8662 Å, from the left to the right, respectively). The meaning of the symbols is as in Fig. 10. The full red lines are the least-squares regressions, whose coefficients are reported in Eq. (2). The dashed lines represent the best fits of flux-flux relations found by Stelzer et al. (2013) for Class III objects. Downward and leftward arrows indicate upper limits on Hα and Ca ii fluxes, respectively.
Current usage metrics show cumulative count of Article Views (full-text article views including HTML views, PDF and ePub downloads, according to the available data) and Abstracts Views on Vision4Press platform.
Data correspond to usage on the plateform after 2015. The current usage metrics is available 48-96 hours after online publication and is updated daily on week days.
Initial download of the metrics may take a while.