Fig. C.2
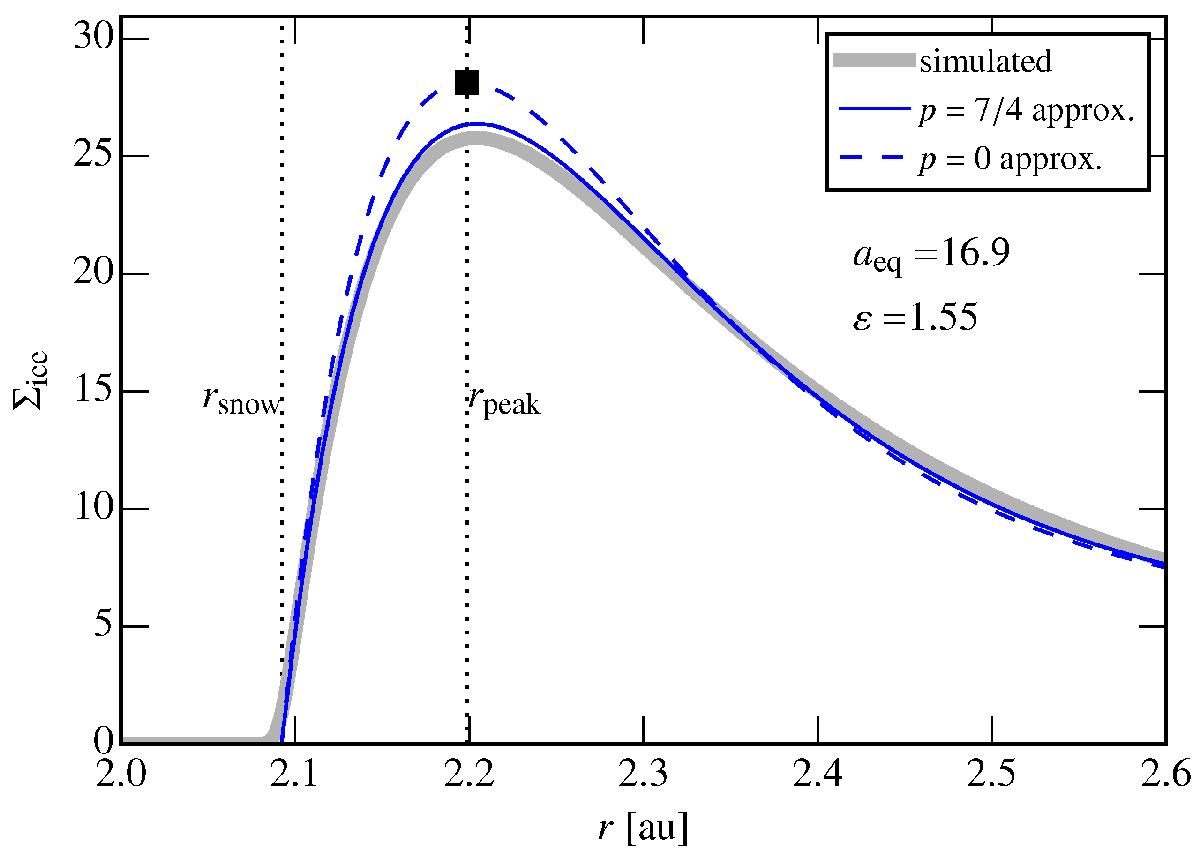
Steady state surface density of ice for the default model parameters. The simulated profile from the numerical model (thick grey line) is well reproduced by the full analytical solution using p = 7 / 4 (solid curve; formula not shown in the main text) and the further p = 0 approximation (dashed curve; Eq. (C.10)). The black square denotes the values corresponding to the mass peak (rpeak,Σpeak) given by Eqs. (C.12) and (C.13).
Current usage metrics show cumulative count of Article Views (full-text article views including HTML views, PDF and ePub downloads, according to the available data) and Abstracts Views on Vision4Press platform.
Data correspond to usage on the plateform after 2015. The current usage metrics is available 48-96 hours after online publication and is updated daily on week days.
Initial download of the metrics may take a while.