Fig. C.1
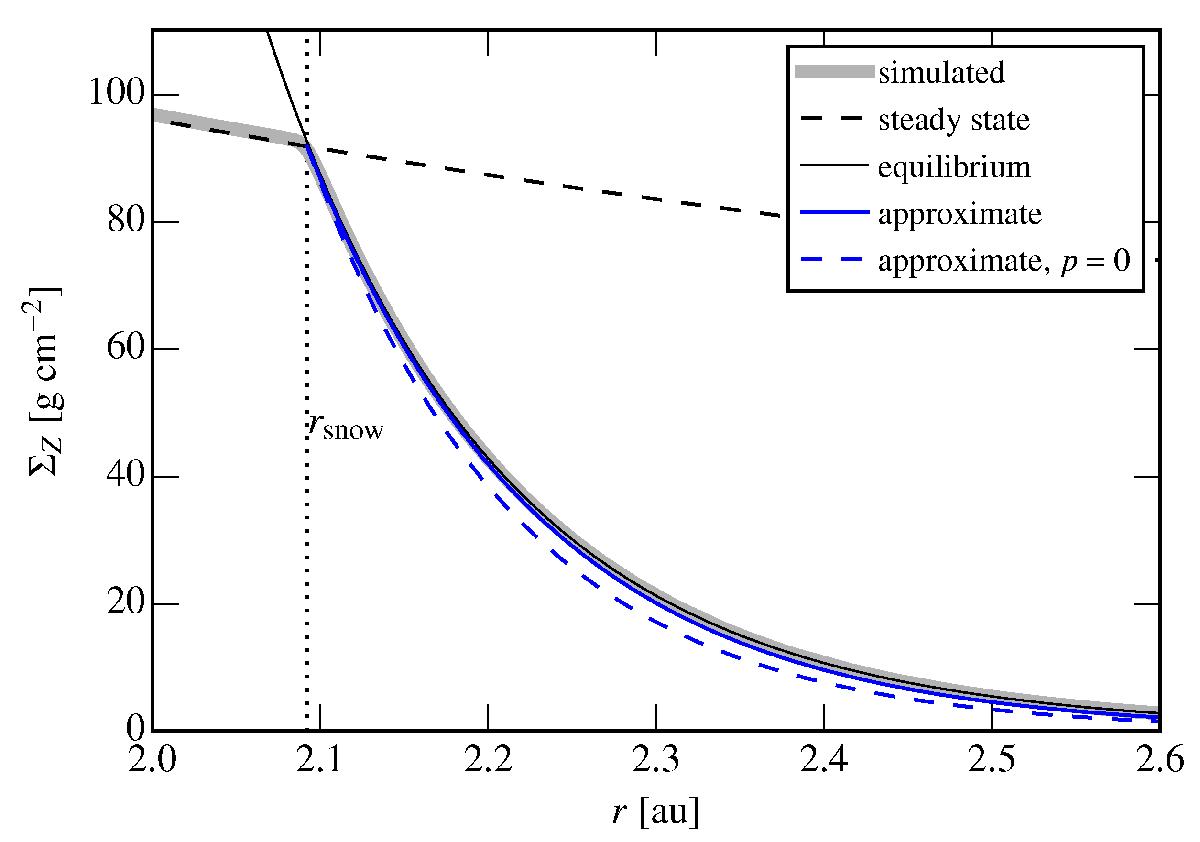
Vapor surface density profiles. Shown in black are the steady state vapor profile when all the ice is in the gas phase (thin solid curve), and the surface density corresponding to equilibrium vapor pressure Peq (Eq. (C.2); dashed solid curve). The snowline rsnow is located at the intersection of these two curves. The numerically-obtained profile (thick gray curve) closely follows the minimum of steady-state and equilibrium profiles. The blue curves present mathematically-convenient approximations to Σeq (see text), valid for r>rsnow.
Current usage metrics show cumulative count of Article Views (full-text article views including HTML views, PDF and ePub downloads, according to the available data) and Abstracts Views on Vision4Press platform.
Data correspond to usage on the plateform after 2015. The current usage metrics is available 48-96 hours after online publication and is updated daily on week days.
Initial download of the metrics may take a while.