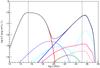
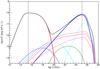
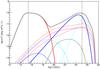
Fig. 4

Variation in the modelled SED when varying R, i.e. moving along the red line in log R-log B space. From left to right, models with log R [cm] = 15.7, 15.3, and 15.0 are shown. Particle densities are adjusted to maintain the same overall flux level between the different models. Definition of the different curves as in Fig. 2.
Current usage metrics show cumulative count of Article Views (full-text article views including HTML views, PDF and ePub downloads, according to the available data) and Abstracts Views on Vision4Press platform.
Data correspond to usage on the plateform after 2015. The current usage metrics is available 48-96 hours after online publication and is updated daily on week days.
Initial download of the metrics may take a while.