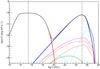
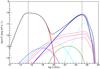
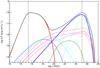
Fig. 2

Variation in the modelled SED when moving along the diagonal in log R-log B space. From left to right, models with log B [G] = 0.5, 1.5, 2.0 are shown. Particle densities are adjusted to maintain the same overall flux level between the different models. Solid red and blue lines indicate the electron and proton synchrotron emission. The dotted and dashed lines show muon-synchrotron emission at the highest energies, and the SSC and muon-synchrotron cascade components at lower energies, as indicated in the legend. The VHE spectrum is absorbed by the EBL, assuming a redshift of 0.116, corresponding to the source PKS 2155-304. The spectral index n1 is chosen to be 1.9. The two dashed vertical lines are there to guide the eye by marking the approximate peak postitions of the model in the central figure.
Current usage metrics show cumulative count of Article Views (full-text article views including HTML views, PDF and ePub downloads, according to the available data) and Abstracts Views on Vision4Press platform.
Data correspond to usage on the plateform after 2015. The current usage metrics is available 48-96 hours after online publication and is updated daily on week days.
Initial download of the metrics may take a while.