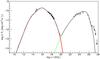
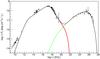
Fig. 10

SEDs for PKS 2155-304 (left figure) and Mrk 421 (right figure) with an SSC model, where only electron synchrotron emission and SSC emission are considered. These solution correspond to a magnetic field with log B [G] = −1.4 and −1.1, and an emission region of size log R [cm] = 16.8 and 16.0, respectively. The solid red line corresponds to the electron-synchrotron emission and the dotted green line to the SSC component. The datasets are described in the text.
Current usage metrics show cumulative count of Article Views (full-text article views including HTML views, PDF and ePub downloads, according to the available data) and Abstracts Views on Vision4Press platform.
Data correspond to usage on the plateform after 2015. The current usage metrics is available 48-96 hours after online publication and is updated daily on week days.
Initial download of the metrics may take a while.