Fig. 2
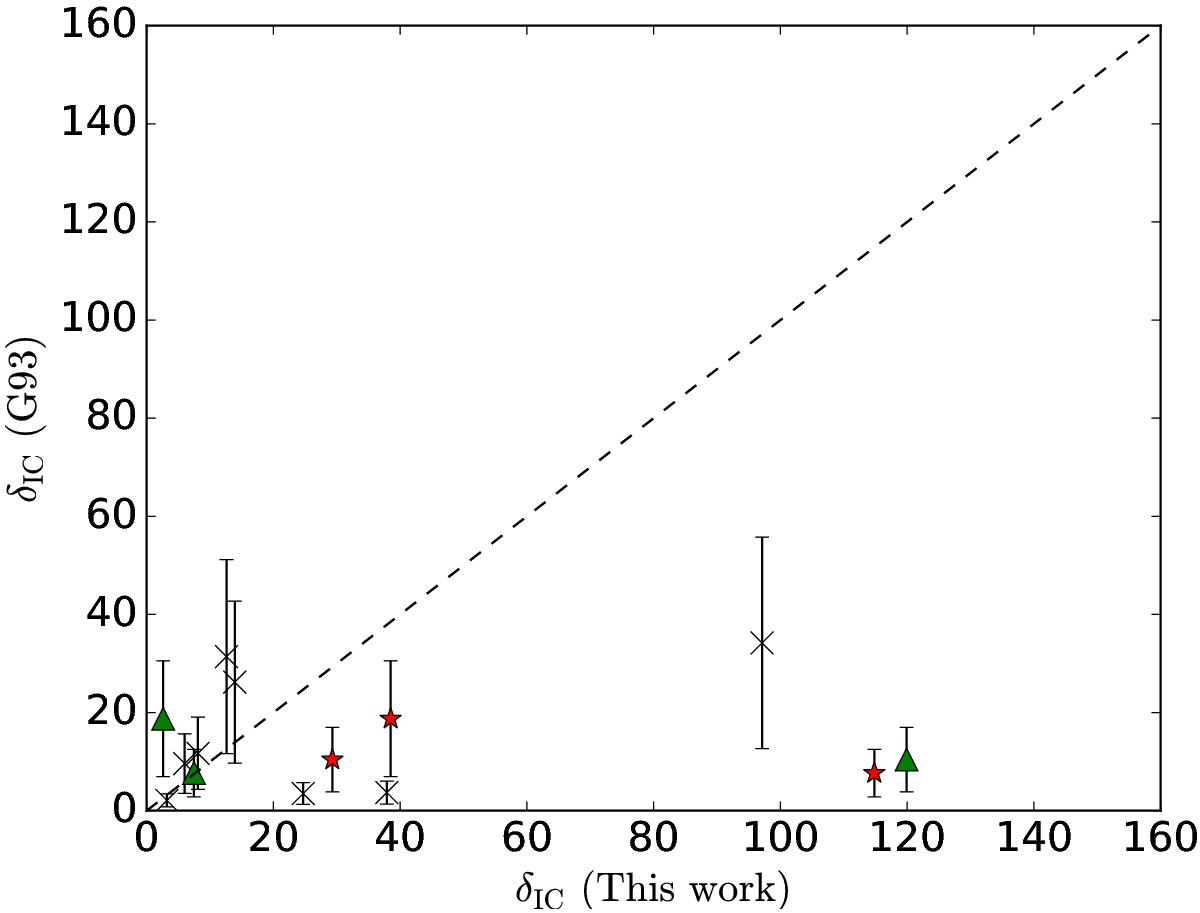
Comparison between the δIC from this work with the δIC from G93. The red ⋆ indicates the 15 GHz, whereas the green triangles indicate the 43 GHz values for the three sources with two δIC estimates. The dashed line represents the equality of the estimates. The error bars on the vertical axis show the on-average 63% from Liodakis & Pavlidou (2015b).
Current usage metrics show cumulative count of Article Views (full-text article views including HTML views, PDF and ePub downloads, according to the available data) and Abstracts Views on Vision4Press platform.
Data correspond to usage on the plateform after 2015. The current usage metrics is available 48-96 hours after online publication and is updated daily on week days.
Initial download of the metrics may take a while.