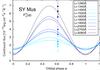
Fig. 7
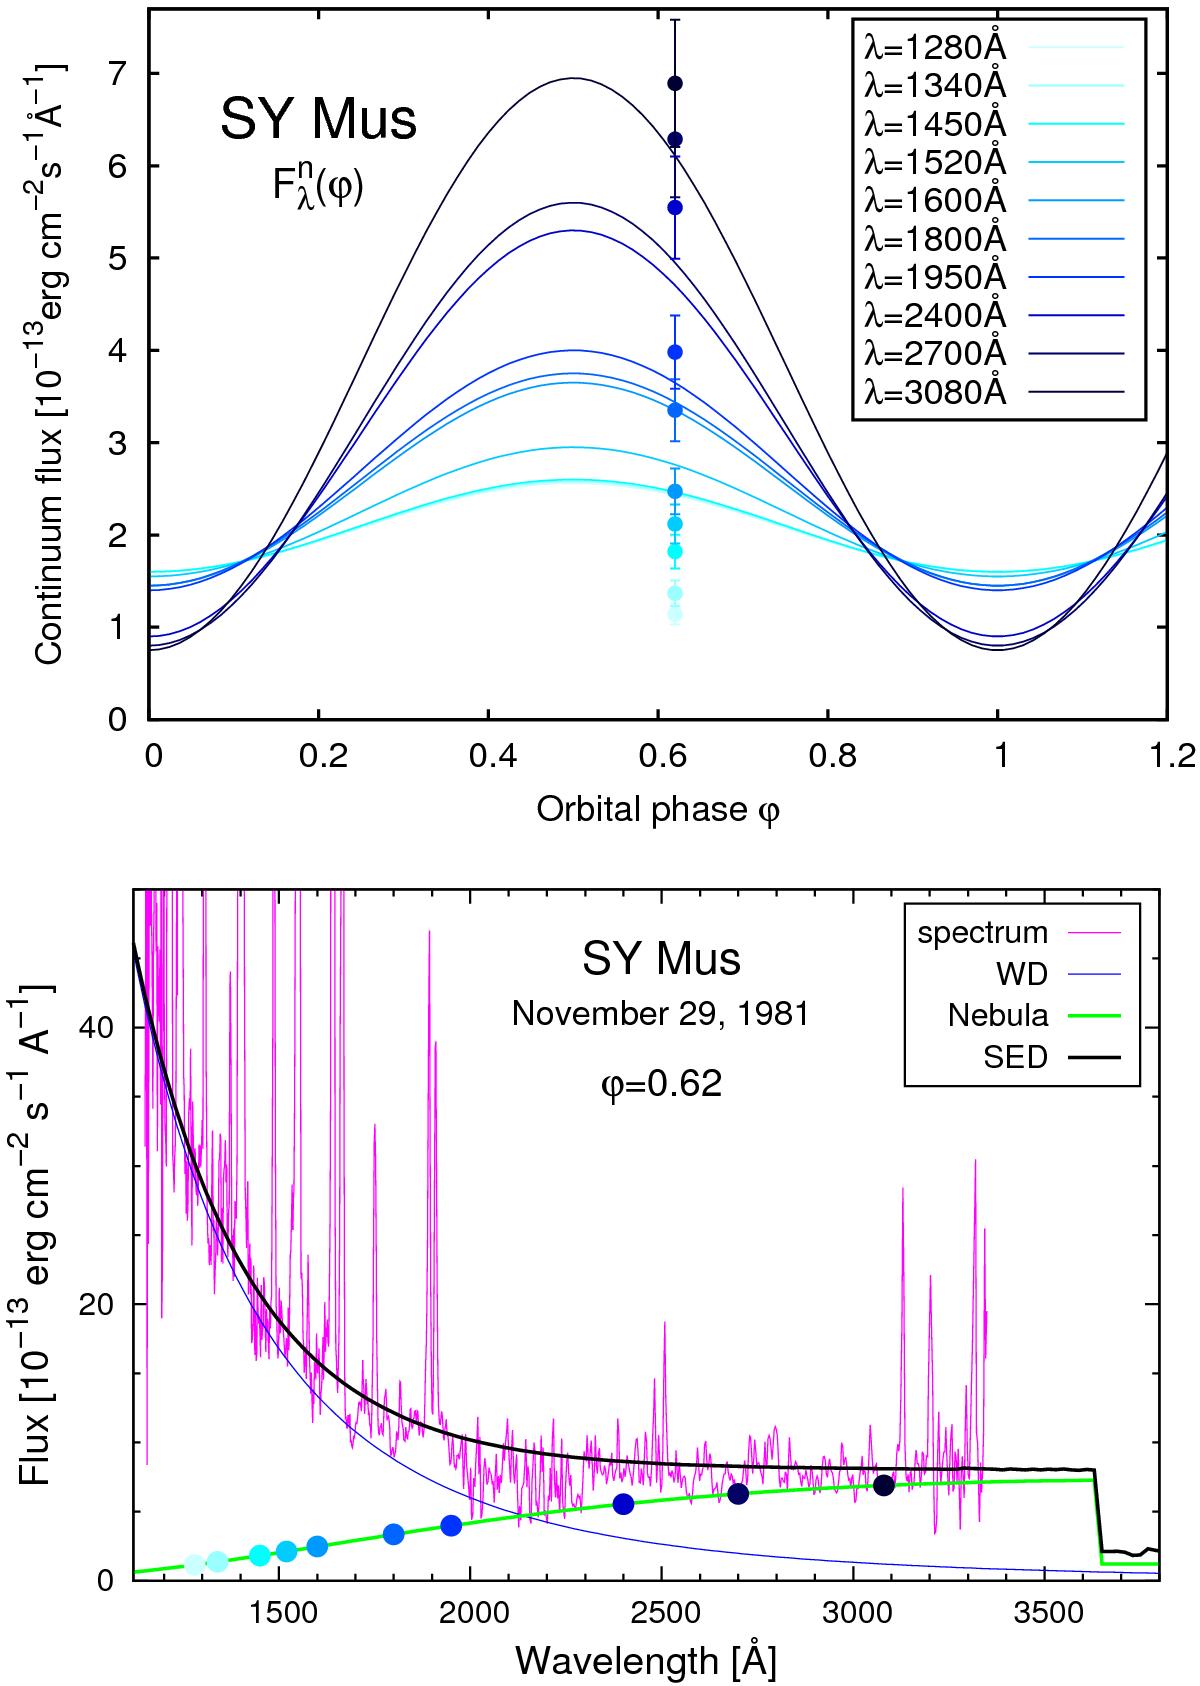
Top: model variations of the nebular continuum radiation in SY Mus (Eq. (3)) at ten wavelengths (solid lines). They are compared with the nebular fluxes at ϕ = 0.62 from the model SED (circles with errorbars). Bottom: model SED of SY Mus at ϕ = 0.62. Circles at the nebular component correspond to those plotted at the top panel.
Current usage metrics show cumulative count of Article Views (full-text article views including HTML views, PDF and ePub downloads, according to the available data) and Abstracts Views on Vision4Press platform.
Data correspond to usage on the plateform after 2015. The current usage metrics is available 48-96 hours after online publication and is updated daily on week days.
Initial download of the metrics may take a while.