Fig. 1
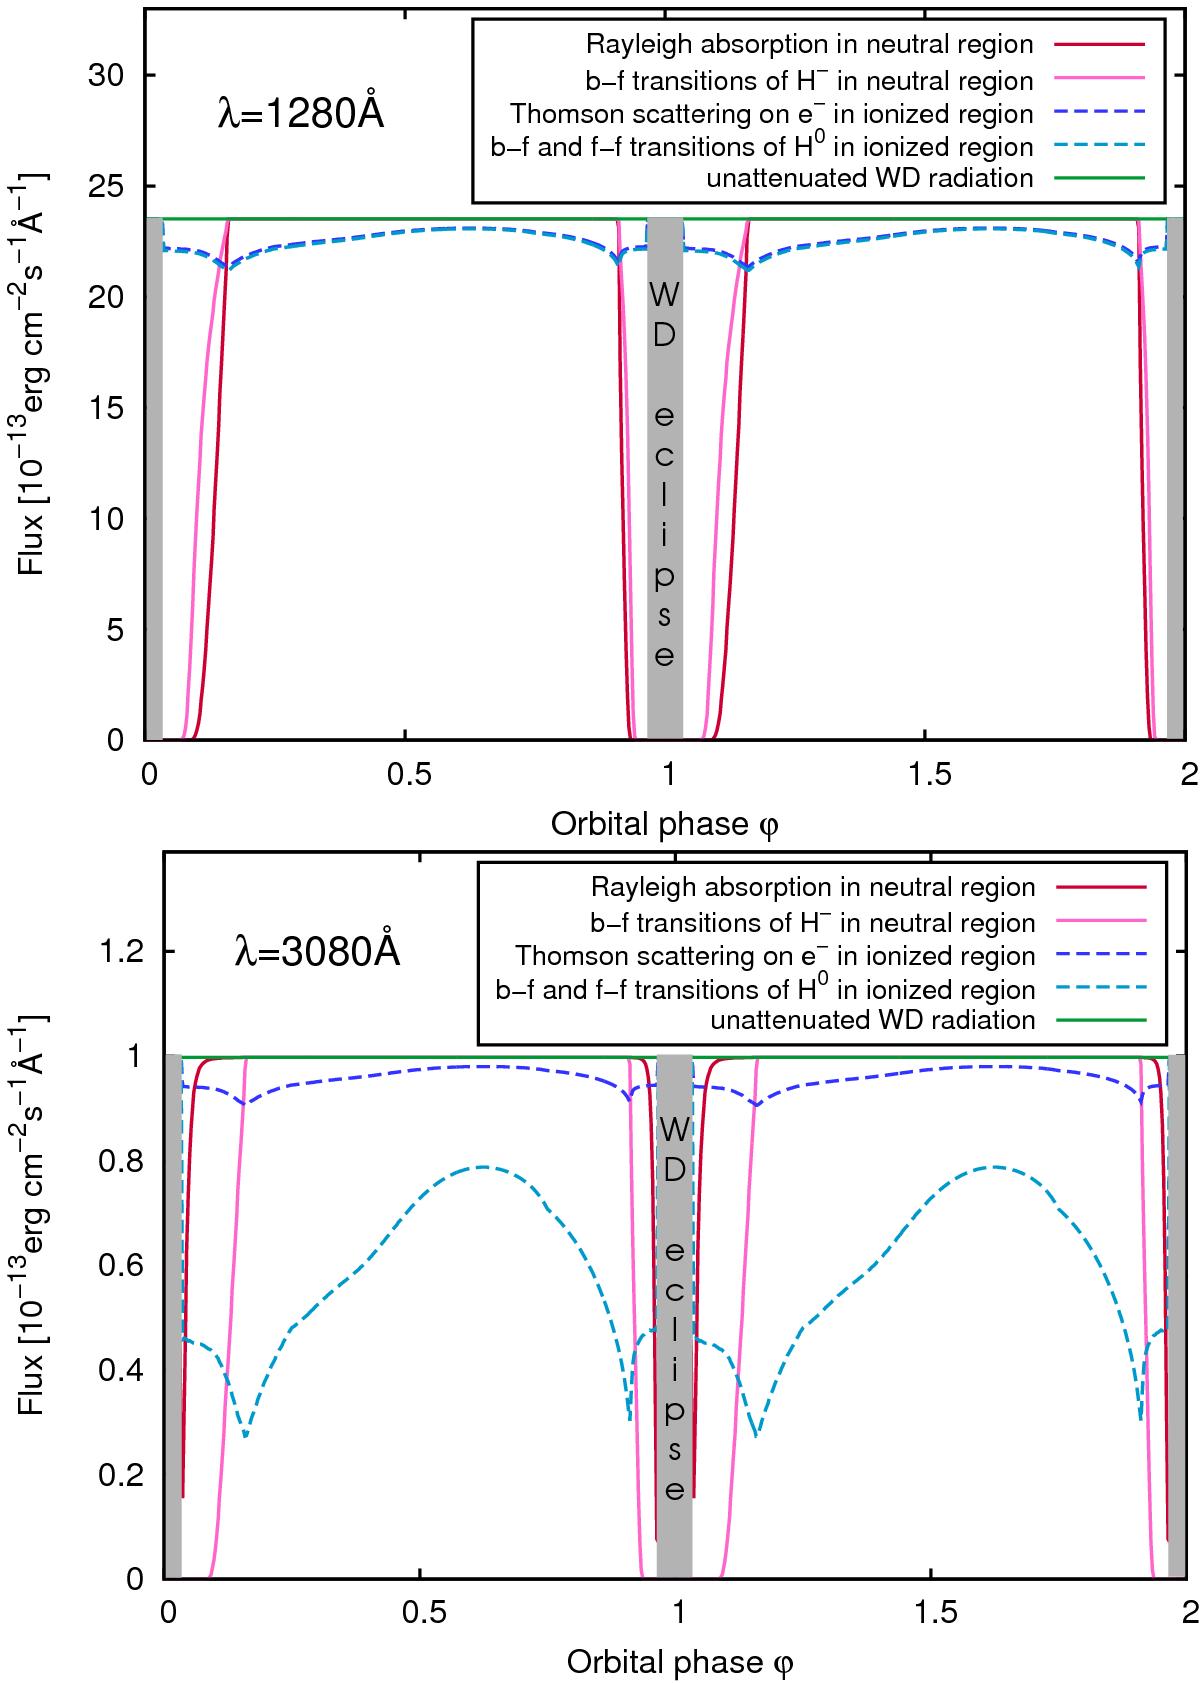
Comparison of the effect of considered attenuation processes on the WD flux (Sect. 3.2) at shortest (top) and longest (bottom) wavelength of the set. Corresponding column densities of H0 in neutral region and H+ in ionized region are given by the column density model in Fig. 5 and of H− in neutral region and H0 in ionized region by the LC modeling (Sect. 4). Two minima of radiation out of the eclipse for attenuation processes in ionized region (dashed lines) correspond to the orbital phase with line of sight entering/exiting the neutral region.
Current usage metrics show cumulative count of Article Views (full-text article views including HTML views, PDF and ePub downloads, according to the available data) and Abstracts Views on Vision4Press platform.
Data correspond to usage on the plateform after 2015. The current usage metrics is available 48-96 hours after online publication and is updated daily on week days.
Initial download of the metrics may take a while.