Fig. 7
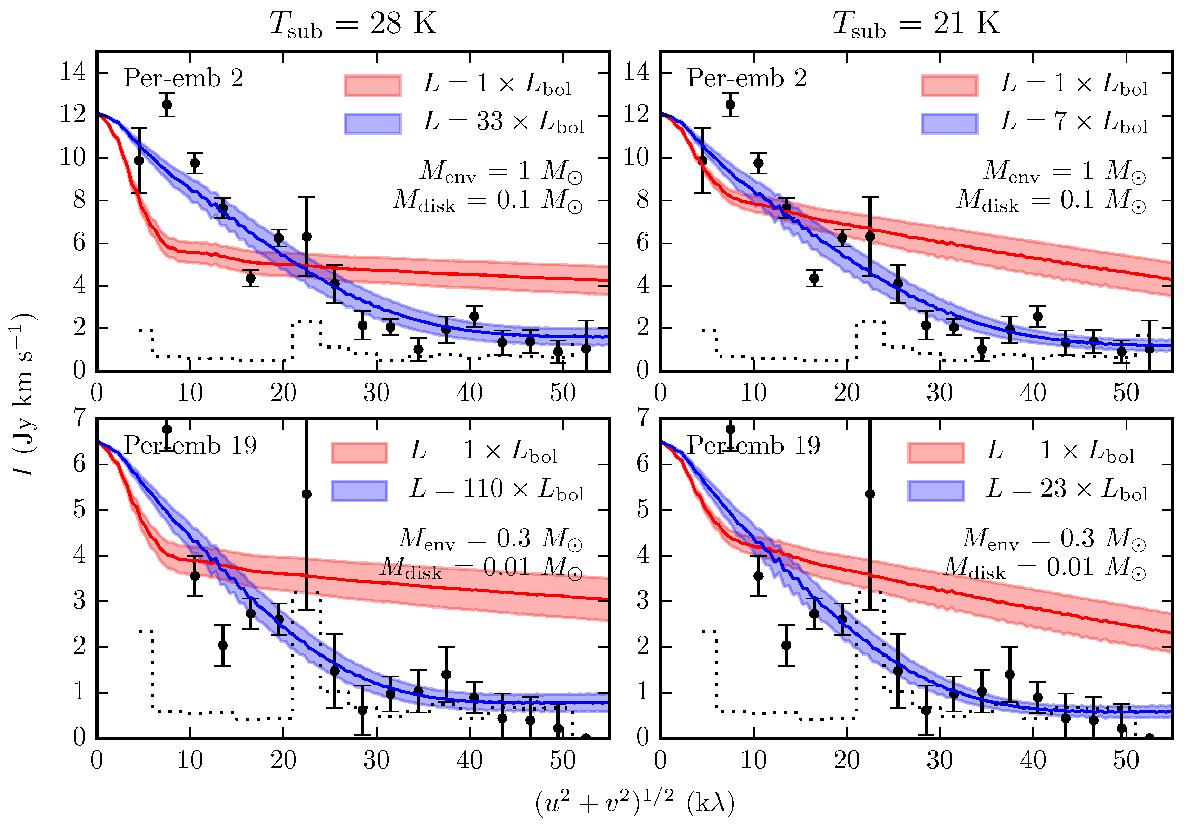
Comparison between observed and calculated (u,v)-amplitudes towards Per-emb 2 and 19. The calculated (u,v)-amplitudes are obtained from the axissymmetric models presented in Appendix B. In both cases we adopt an envelope power-law index of 1.5 and outflow half opening angle of 10◦. The adopted disk and envelope masses are printed in the panels and were motivated by the measured masses listed in Table 4. The model visibilities are averaged over 11 viewing angles and are shown as solid lines with shaded 1σ uncertainty regions. To account for the degeneracy between the assumed model masses and CO abundances, the model visibilities are normalised to the integrated single-dish flux density of each of the sources. The flux densities were estimated by convolving the moment-zero maps with a 20′′ Gaussian beam before reading the flux density at the source position. The red and blue model visibilities show the expected (u,v)-amplitudes for the current luminosity and for the luminosity needed to provide a good fit to the measured data. Panels to the left adopt a sublimation temperature of 28 K while panels to the right assume a sublimation temperature of 21 K.
Current usage metrics show cumulative count of Article Views (full-text article views including HTML views, PDF and ePub downloads, according to the available data) and Abstracts Views on Vision4Press platform.
Data correspond to usage on the plateform after 2015. The current usage metrics is available 48-96 hours after online publication and is updated daily on week days.
Initial download of the metrics may take a while.